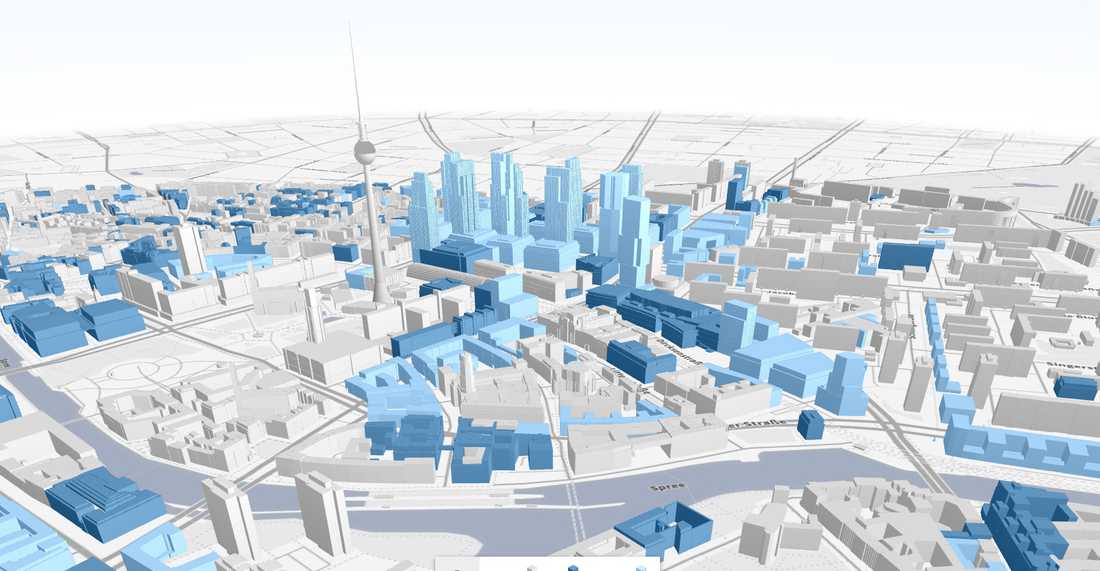
Our new project "Berlin's New Skyline" uses OSMBuildings to render a interactive 3D map.
In this article I will show you how to create a 3D map based on OSMBuildings with custom geojson data and fly-to animations.
Background
Last week we published the project "Berlins neue Skyline". It's about how Berlin has changed in the last 25 years and how it might look in the future. We wanted to focus especially on the proposed skyscrapers, so we decided that a 3D visualization would be the perfect form of visualization.
Choosing the right framework
Before we started to develop the project, we tested some webgl based 3d map libraries. At that time I also published an article about the different 3d map frameworks that were available. At the end we chose OSMBuildings, because:
- It's very lightweight. That means that you have a smaller codebase and you can fix/add/change certain features easier.
- Support to add own .geojson and .obj data to the map.
More over Jan Marsch, the founder of OSMBuildings who also has his office in Berlin was interested in collaborating with us. He helped us with converting 3D data and added some features like growing buildings or the possibilty to only display buildings from a certain type (in our case the build year).
Hands on
You can find OSMBuildings and the belonging documentation on github.
To create a basic map you need to include OSMBuildings.js, GLMap.js and GLMap.css.
For this example I used cartodb map tiles for the basemap.
<head><link rel="stylesheet" href="css/GLMap.css"><style type="text/css">* {margin: 0; padding: 0;}html, body {height: 100%;}#map {width: 100%; height: 100%;}</style></head><body><div id="map"></div><script src="js/GLMap.js"></script><script src="js/OSMBuildings-GLMap.js"></script><script>// create map enginevar map = new GLMap('map', {position: {latitude: 52.514, longitude: 13.35},zoom: 17,rotation: 0,tilt: 40,attribution: '© <a href="http://www.openstreetmap.org/copyright">OpenStreetMap</a> contributors, © <a href="http://cartodb.com/attributions">CartoDB</a>'});// add osmbuildingsvar osmb = new OSMBuildings({}).addTo(map);// add basemap tilelayerosmb.addMapTiles('http://{s}.basemaps.cartocdn.com/light_all/{z}/{x}/{y}.png');</script></body></head>
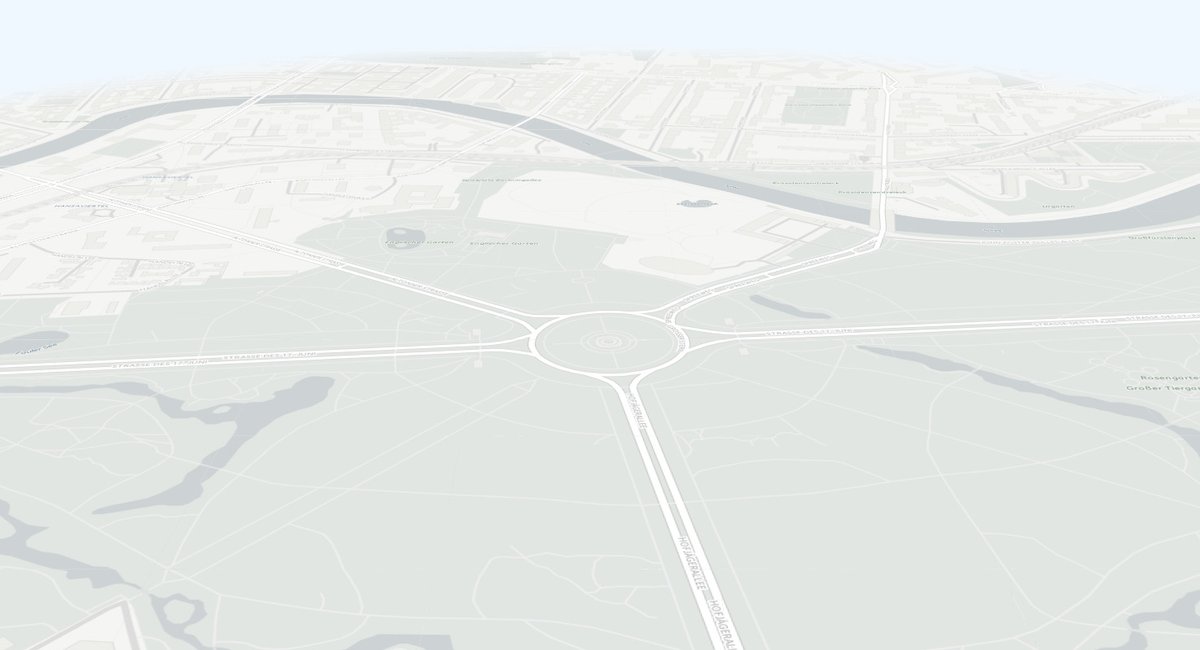
If everything works you should see an empty map like this:

Add buildings
If you want to display all OpenStreetMap buildings, you can use this data url:
osmb.addGeoJSONTiles('http://{s}.data.osmbuildings.org/0.2/anonymous/tile/{z}/{x}/{y}.json');
For our project we added some custom geojson tiles. The tile generator script is not open sourced yed but Jan Marsch is working on it. (Update: The converter is now available on github)
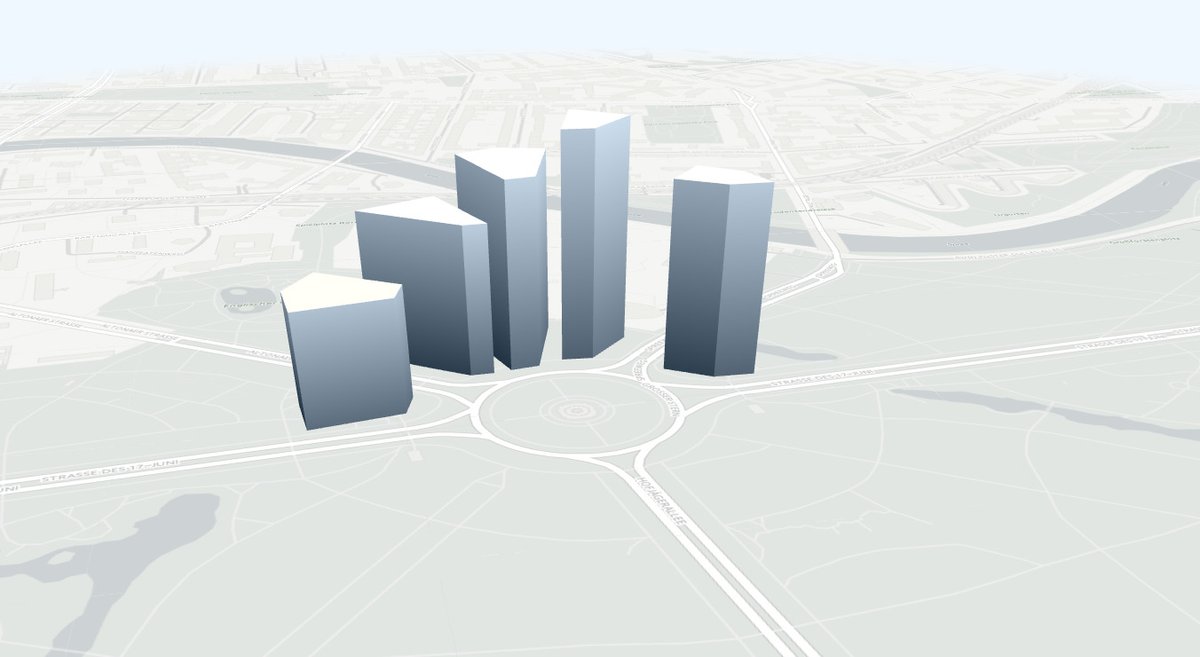
You can find the geojson we used for this example on github. Let's assume that there are some skyscrapers planned in the "Tiergarten" next to the "Siegessäule" in Berlin. Now we want to visualize the building plans. In order to display the geojson, we need to add the following line:
osmb.addGeoJSON('/path/to/osmb-testdata.geo.json');
The following properties are supported by OSMBuildings:
colorroofColorheightminHeight(distance from the building to the ground)
I used the
color and height properties. After adding the dataset, you should see these buildings:
Animations
If you want to add some animated flights to your map, you need to include an animation library. In our project we used Tween.js. With Tween.js you can interpolate from a value to another and call functions with the current values while updating them. We want to keep it simple, so we just fly from one point to another:
var valuesFrom = {latitude: 52.515,longitude: 13.3485,rotation: 0,zoom: 17,tilt: 25,},valuesTo = {latitude: 52.5155,longitude: 13.35,rotation: -25,zoom: 17.2,tilt: 50,},animationTime = 2500;var tween = new TWEEN.Tween(valuesFrom).to(valuesTo, animationTime).onUpdate(function () {// here we call the functions to update the map statemap.setPosition({ latitude: this.latitude, longitude: this.longitude });map.setRotation(this.rotation);map.setZoom(this.zoom);map.setTilt(this.tilt);}).start();requestAnimationFrame(animate);function animate(time) {requestAnimationFrame(animate);TWEEN.update(time);}
To give you a better understanding of how OSMBuildings works together with Tween.js I created an interactive example.
You can click on the buttons to fly from one point to the other one (be aware that you need webgl in order to use it): example.
Questions?
If you have any questions feel free to comment below or contact us via twitter.
Further Reading
