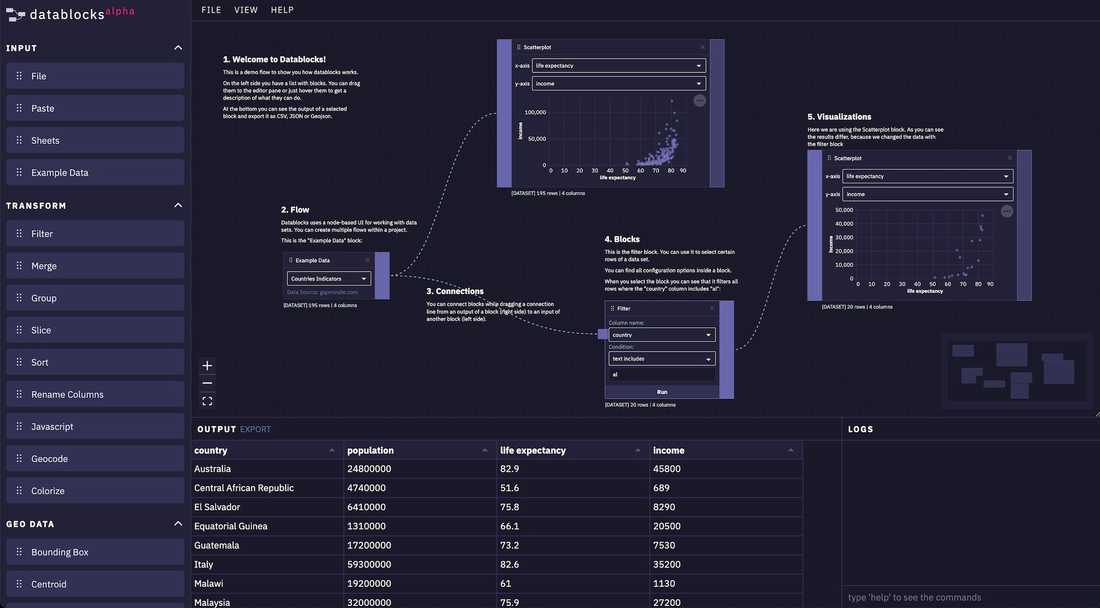
datablocks introduction flow
To make our daily work more effective and fun we built a node based editor called datablocks for processing and visualizing data. This post should help you to understand what you can do with datablocks and why we build it. When you are interested in testing the alpha version or when you have any ideas or feedback we would be very happy to hear from you.
Request Alpha Access
datablocks is currently in private alpha. You can enter your email here to get access and optionally subscribe to our newsletter.
Why We Needed a New Tool
At webkid we have developed a lot of small and medium sized web based data visualizations. For all these visualizations we needed - of course - some data. The data comes in various forms. There are csv files, jsons, geojsons, topojsons, shape files, xlsxs and other exotic formats. For all our projects we used different tools and wrote a lot of custom scripts to convert files, merge data, format data types, do some clean up, get insights and so on. At the end we always wanted to output a tiny file or multiple ones that we could use in our final applications.
When we are dealing with geo data we use geojson.io for quickly see data on a map and mapshaper to simplify data, dissolve features or converting it to another format. In our scripts we work with turf.js for processing geo data. Most of our data processing work is done with custom node scripts. Besides turf.js we use d3-dsv for parsing csv files, lodash for cleaning up data and node standard lib for read in and writing files. ObservableHQ is super nice and we are using it a lot but more for writing d3 snippets and stuff like that. Jupyter notebooks where never part of our daily work because we don't like to switch programming environments/languages during a project.
After a few years of writing custom scripts for our data tasks we didn't want to write another script like:
read in data, read in another data, merge data, clean up data, write json file. That was the point where we came up with the idea to build a tool with a simple UI that is also flexible enough to handle our different needs.What is datablocks
Datablocks is a node based editor with several blocks for processing data. It's based on our open source library React Flow. The editor is divided into four parts. On the left you have the sidebar with the different blocks. In the center you can find the editor pane and at the bottom there is the data output view and a terminal.
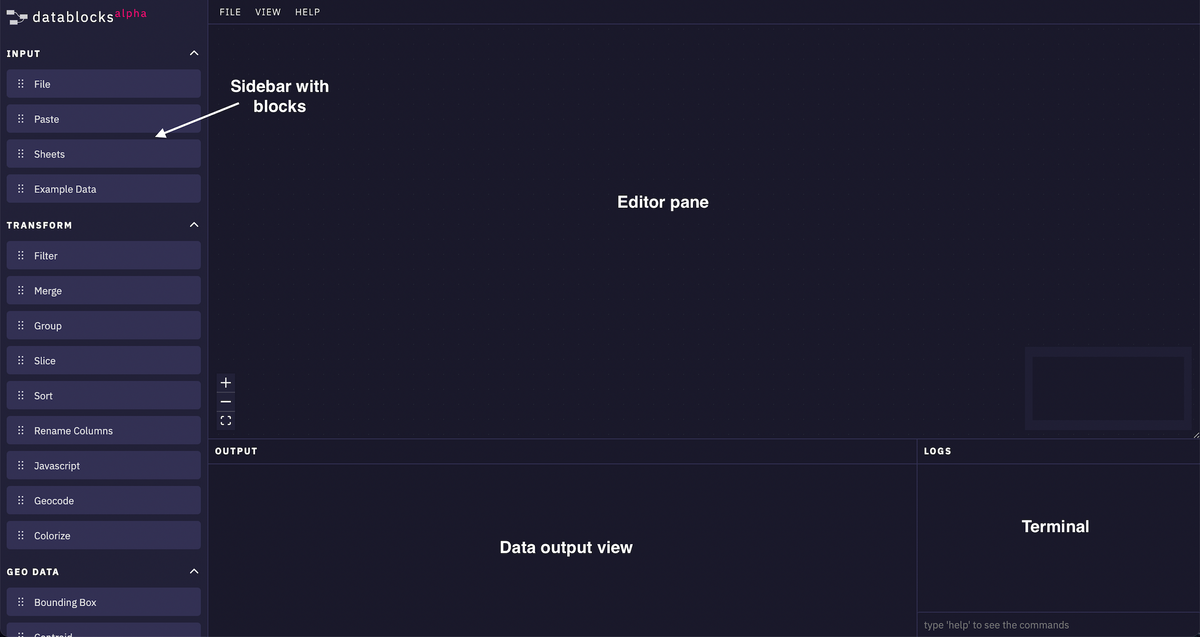
The sidebar: We divided the blocks into the groups Input, Transform, Geo, Visualization and Misc. The input group gives you blocks to read in data. Either by paste text content or by file upload. Currently, datablocks can handle json, csv, topojson and geojson files. There is also an example data block for testing and playing around. The transform blocks handles tabular data. You can filter data entries or merge different data sets for example. The geo blocks help you to simplify data or converting geo formats. With the visualization blocks you can create simple visualizations like a histogram or a bar chart. The misc section contains markdown and a simple statistics block for now.
The editor pane: This is place where you are working most of the time. On the editor pane you can connect different blocks to create a data flow and you can configure the blocks. In the current version all configuration happens in the blocks. We might add another panel on the right side for more complex configurations or code input like the Javascript block but for now we like the idea to be able to see all settings at once.
At the bottom you can find the data output view. This view shows you the output of the selected block. It can display tabular data, JSON objects and geojson data. You can also export your data as csv, json or geojson.
In the right bottom corner is the terminal. It's used to display application errors or logs from the Javascript block. There are also some commands you can type in but thats more of a gimmick for now.
How We Use It
To give you a better understanding of datablocks we have written down three example tasks. We are using data from the example data block so that you can easily try it on your own.
Filter Data Entries
In this example we filter all data entries where the population is greater than 500k. As you can see on the image we are using the Example Data block as input and connect it with the Filter block. Depending on the data type of the chosen column you have several filter condition possibilities.
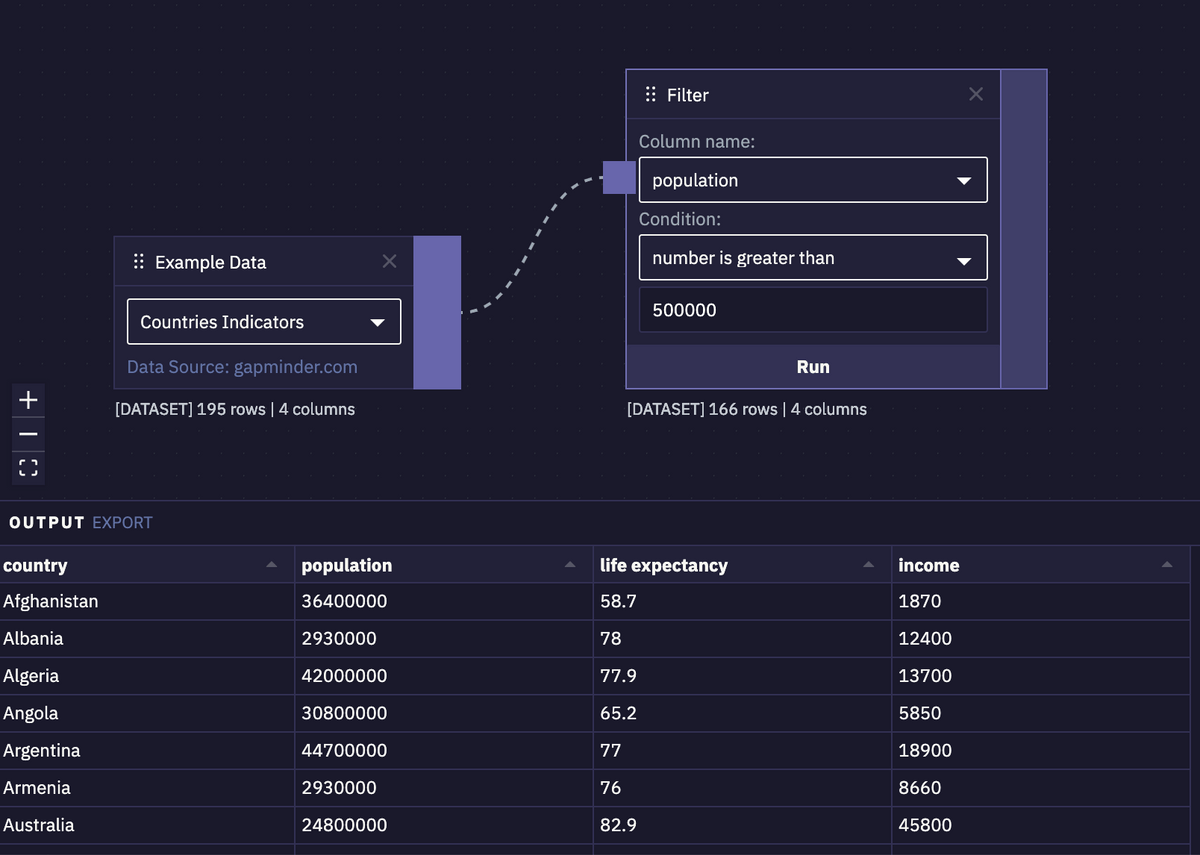
The type of the output and the number of rows is displayed at the bottom left of a block. The original data set had 195 rows. After we applied the filter it was reduced to 166 lines. Now we can export the result as csv or json in the data view.
Geocode Addresses and Visualize Points
Geocoding data is also a job we had to do a lot of times. We wrote a script that we could adjust but now that we have datablocks it's a lot easier for us. You can specify the address column and choose google maps api or here as a provider. The Geocode block then appends a latitude and longitude column to the data set.
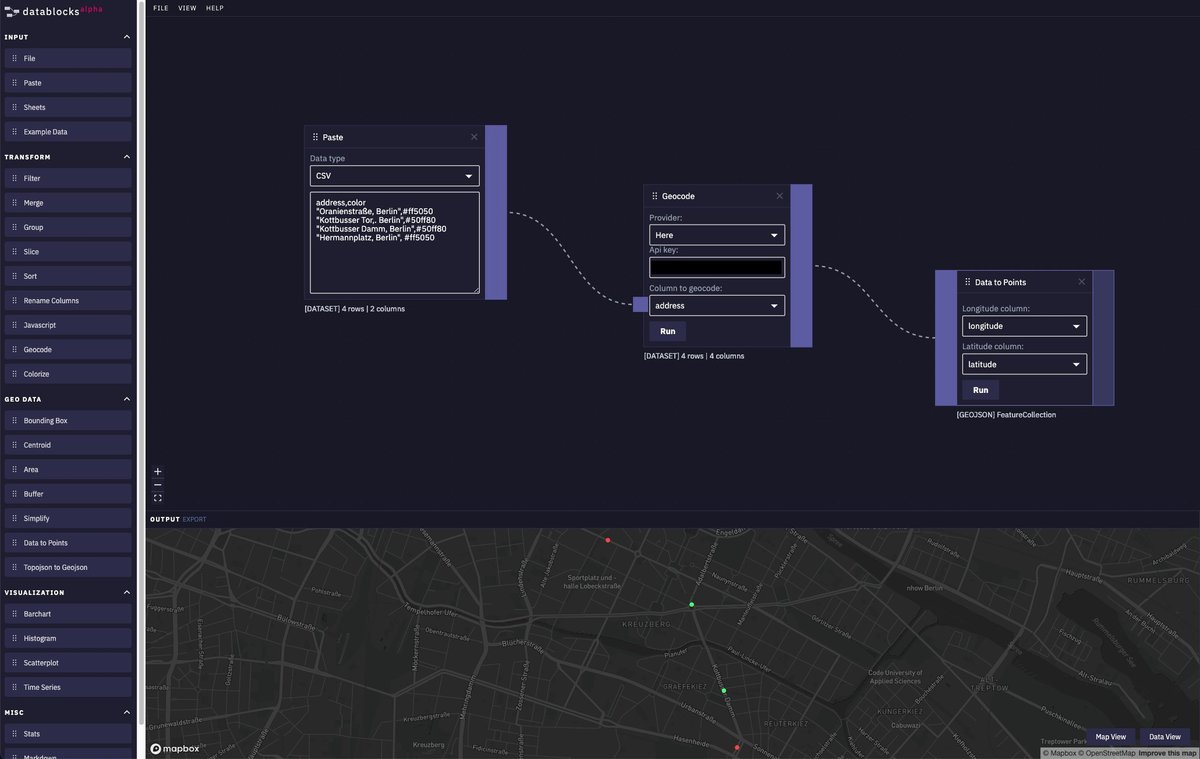
In the example above we are additionally using the Data To Points block to create a geojson file that we can preview in the data view panel.
Transform Data with JavaScript
The block we use the most is the JavaScript block. It has two inputs and outputs the return value of the function you are writing. Inside the blocks you can use lodash (it's injected by default) but we are working on a way so that you can also install npm modules. It's really handy to just drag a json file onto the editor, connect the JavaScript block and write some lines to transform it. In this example we are grouping the geojson features by a property called "BEZNAME" (german short form for district name in this geojson file), then sum up the area for every district and output them as a bar chart.
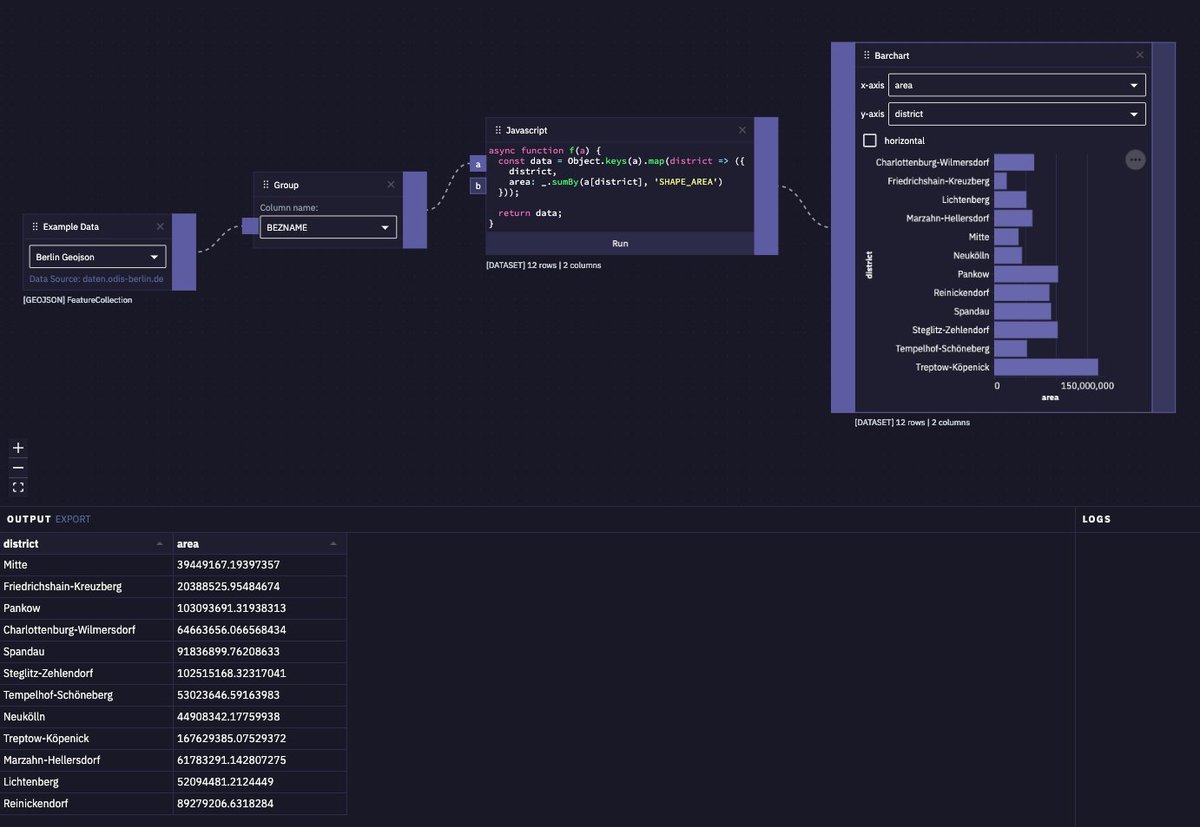
The code on the screenshot is hard to read. This is it:
export function(a) {const data = Object.keys(a).map((district) => {district,area: _.sumBy(a[district], 'SHAPE_AREA')}, []);return data;}
The variable
a is the output of the connected Group block and the data variable is the output of the JavaScript block. This block makes datablocks really flexible. For the common tasks you can use the predefined blocks and whenever you need something special you can utilize the JavaScript block.The Future of datablocks
Until now, everything is still undecided where the journey with datablocks goes. Ideally we would like to release it as open source software but we would need to find a way to finance it. First of all we want to find more alpha users and bring datablocks up to good level so that we are able to release a beta version. When we go into the next phase, we will reconsider how we can secure the further development.
Request Alpha Access
datablocks is currently in private alpha. You can enter your email here to get access and optionally subscribe to our newsletter.
If you have any ideas or feedback in general, feel free to contact us.
Further Reading
