Maps
Data Analysis
– February 13, 2016
How to process geospatial data with Node.js and TURF

Moritz Klack
@moklick
In the last two years we created several map projects. When you do projects like this it's a common task that you have to process geospatial data before you can use it. You have to filter it, clean it up, aggregate it, analyze it, etc. There are tools like QGIS that help you to do these tasks, but for me as a web developer it was always a hassle to start this heavy UI when I just want to find and save points that are in a certain polygon for example.
TURF.js to the rescue
At some point I stumbled upon TURF.js. As they point out on their website TURF does "advanced geospatial analysis for browsers and node". I use it a lot in my daily work and so I want to share some real world examples with you. If you are interested in using TURF in the browser there is a good introduction you can check out. This article is about how to use TURF in combination with Node.js.
The very basics
If you want to process some data with TURF you always have to convert it to GeoJSON, because TURF "expects the data to be standard WGS84 longitude, latitude coordinates". Luckily TURF offers helper functions to convert all the different types (
LineString, Polygon, MultiPolygon, and so on). In order to run the following examples you need node >= 5 and these modules:npm install turf d3-dsv --save
Measure distances
In a recent project we started with a data set containing city names and their centers (longitude,latitude). We also wanted to show the distance of each city to Berlin so we used TURF to add these values.
For this task we use the functions
point and distance. The point function simply converts an array (longitude,latitude) to a GeoJSON representation. The distance function returns the distance in kilometers of the two passed points. It also takes a third parameter that can be degrees, radians, miles, or kilometers. So if you have a CSV file that contains the columns "longitude" and "latitude" and you want to add a "distance" column, you could do something like this:const Fs = require('fs');const Turf = require('turf');const D3Dsv = require('d3-dsv');// define centerconst CENTER = Turf.point([13.4, 52.52]);// read in csvconst csvInput = Fs.readFileSync('./cities.csv').toString();// parse csvconst jsonData = D3Dsv.csvParse(csvInput);// add distance field for each entryjsonData.forEach((el) => {const dataPoint = Turf.point([el.longitude, el.latitude]);el.distance = Turf.distance(CENTER, dataPoint);});// write csv resultFs.writeFile('./cities-with-distances.csv', D3Dsv.csvFormat(jsonData));// or if you need json ...Fs.writeFile('./cities-with-distances.json', JSON.stringify(jsonData));

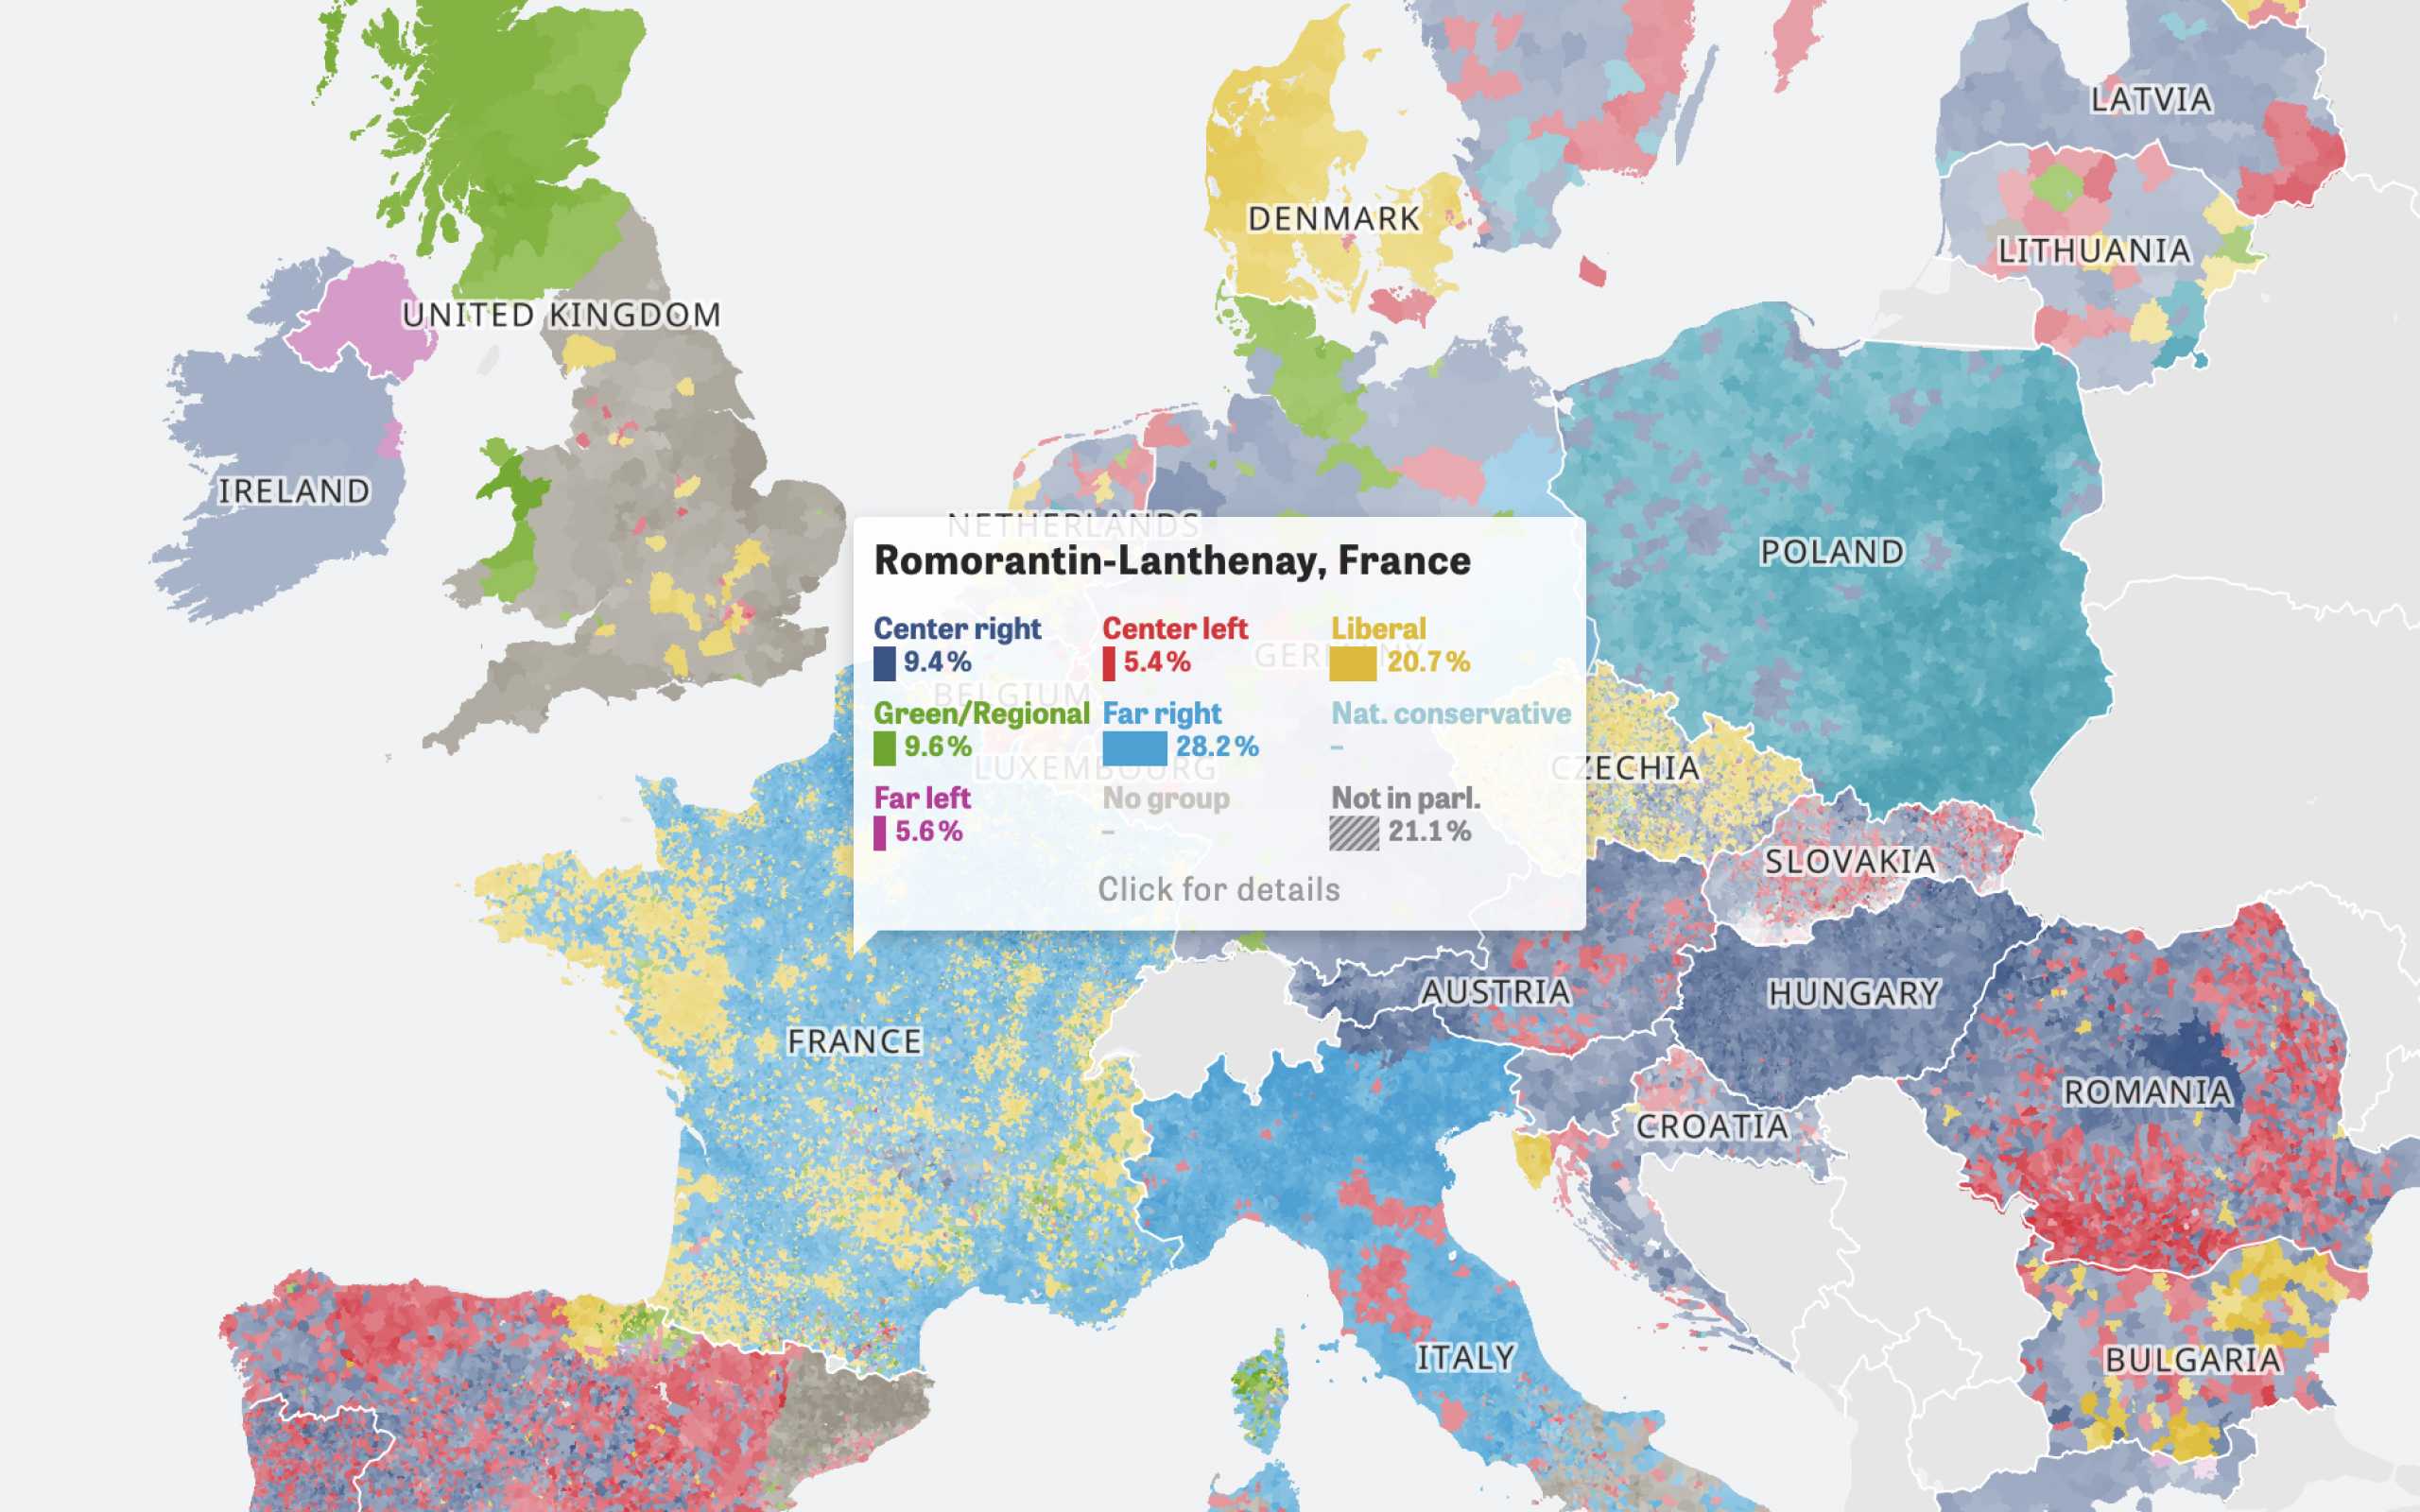
Colors Of Europe
Interactive Data Visualization (Zeit Online)
Are you interested in a collaboration?
We are specialized in creating custom data visualizations and web-based tools.
Aggregation
Let's say we have a data set with houses (points) and some districts (polygons). We don't know which house belongs to which district but we want to do some aggregation of the house data. For every district we want to calculate the minimum, maximum, sum and medium of the residents. For this we can use the
aggregate function. The aggregate function takes three parameters. A feature collection of polygons, a feature collection of points and an array with definitions which type of aggregation we want to do for which field. Besides min, max, sum and median you can also calculate the average, deviation, variance and count.const Fs = require('fs');const Turf = require('turf');// read in json// for this example a point needs the property "residents":// "properties": {// "residents": 23// }const houses = JSON.parse(Fs.readFileSync('./houses.geo.json')); // feature collection of pointsconst districts = JSON.parse(Fs.readFileSync('./districts.geo.json')); // feature collection of polygons// define aggregationsconst inputField = 'residents';const aggregations = [{aggregation: 'min',inField: inputField,outField: `${inputField}_min`,},{aggregation: 'max',inField: inputField,outField: `${inputField}_max`,},{aggregation: 'sum',inField: inputField,outField: `${inputField}_sum`,},{aggregation: 'median',inField: inputField,outField: `${inputField}_median`,},];const aggregated = Turf.aggregate(districts, houses, aggregations);// write aggregated result as geojsonFs.writeFile('./districts-aggregated.geo.json',JSON.stringify(Turf.featurecollection(aggregated)));
If you are lazy, you could also create the array with aggregations this way:
const aggregations = ['min', 'max', 'sum', 'median'].map((aggregationType) => {return {aggregation: aggregationType,inField: inputField,outField: `${inputField}_${aggregationType}`,};});
Finding points in polygons
Image you have several points of interest but you only want to look at points in a certain neighbourhood. In order to do this you can use the
within function. This function takes a feature collection of points and a feature collection of polygons. It then returns all points that are in at least on of the passed polygons.const Fs = require('fs');const Turf = require('turf');// read in jsonconst points = JSON.parse(Fs.readFileSync('./points.geo.json')); // feature collection of pointsconst neighbourhood = JSON.parse(Fs.readFileSync('./neighbourhood.geo.json')); // feature collection with one polygonconst poisResult = Turf.within(points, neighbourhood);// write jsonFs.writeFile('./points-within-neighbourhood.json', JSON.stringify(poisResult));
What else?
Be sure to check out the TURF API docs. There are lots of more things you can do with it! If you have any questions, just leave a comment below or contact me on twitter.
Further Reading