Maps
– July 07, 2015
How we created an interactive map of Europe with 100k+ areas

Moritz Klack
@moklick
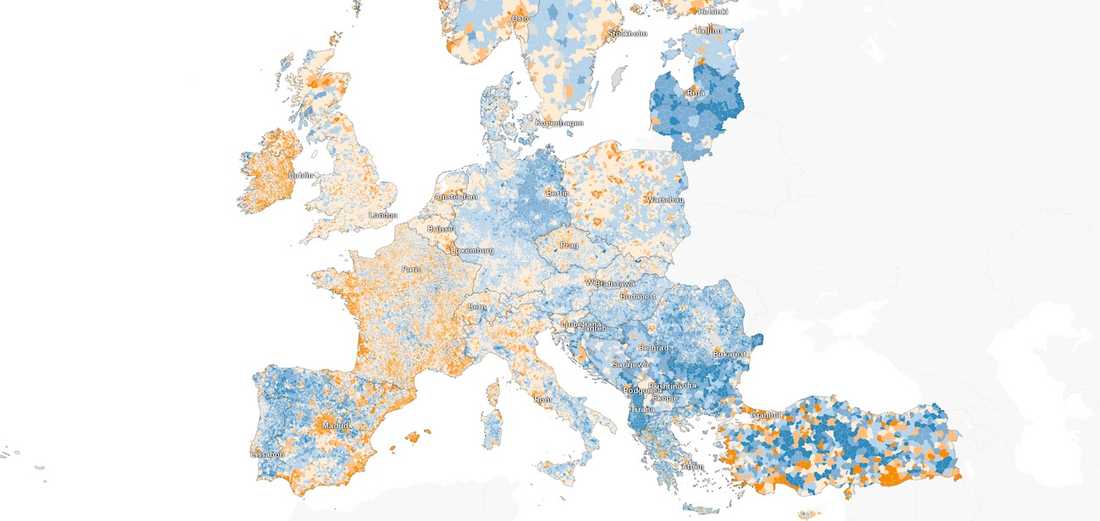
Recently we published an interactive map that visualizes where the population in Europe grows and where it declines. It is a very detailed map with 119.406 colored polygons. You can hover each of them to get the information of the specific area. In this post we will show you how to create a similar map with only a few lines of code.
For this example we are using a dataset from Berlin that includes houses and their floor numbers. I found it while searching for a granular shapefile that already includes data. The data was published by the “Senatsverwaltung für Stadtentwicklung und Umwelt Berlin”.
Preconditions
Before we start we need to do these steps:
- Install Tilemill - We are using Tilemill instead of Mapbox Studio, because it’s not possible to create a source with such granular data with Mapbox Studio. Please correct me if I am wrong.
- Get the dataset - This is a shapefile that already includes the data. Normally you have to merge your dataset with a shapefile. There are a lot of ways to do this. This tutorial shows you how to join data to shapefiles with QGIS.
- Get a Mapbox Account - There is free plan with 50k map views included. If we find the time, we will write a post about how to create and host tiles on your own machine.
Let’s get started - Create a new project
We begin with styling the layer of our map that displays the data. To do this we have to open Tilemill and create a new project.
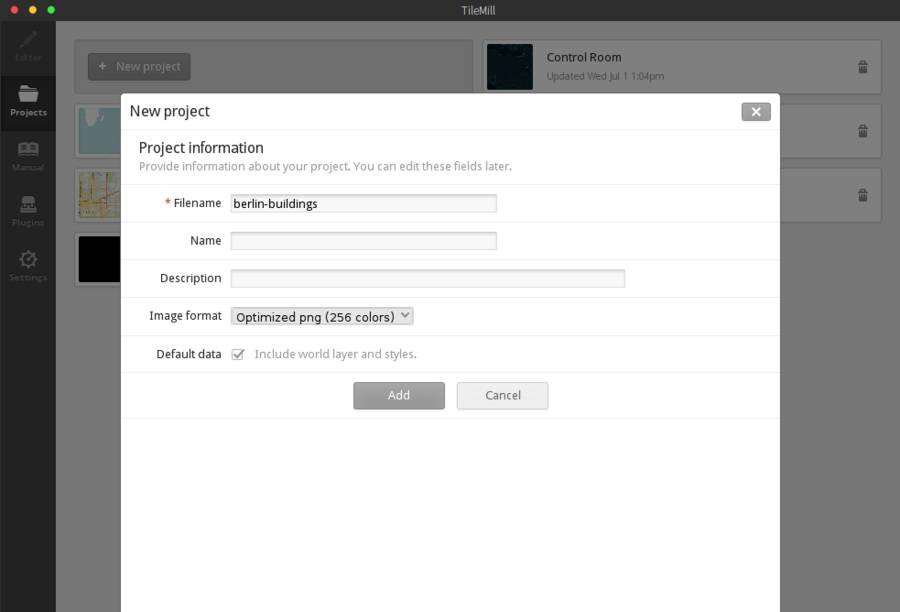
Now you should see a world map on the left and some Carto CSS rules on the right side. So the left side is basically your map preview and on the right side you define the styles for the different parts of your map.
Adding the layer
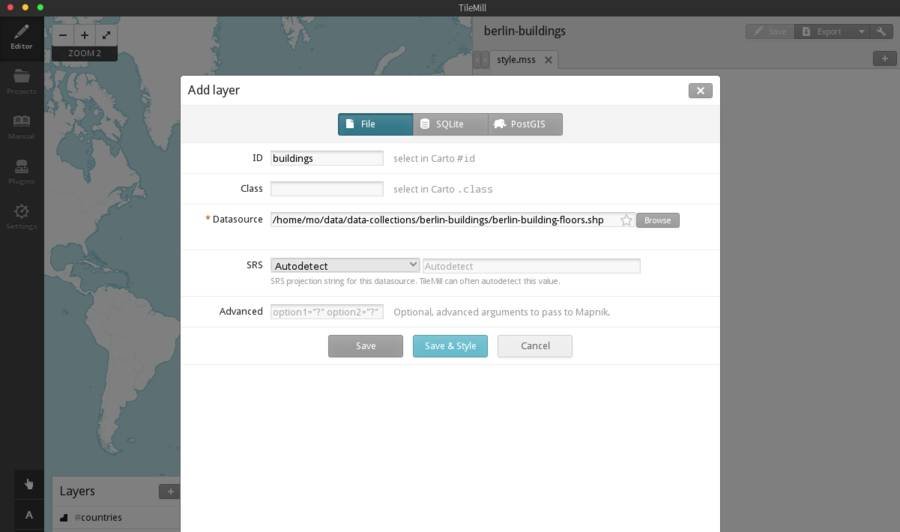
In the next step we have to add our shapefile as a new layer. To do this click on the layers icon in the bottom left corner and then “Add Layer”. Now type in “buildings” as the ID, choose the shapefile as the datasource and save it. Now we can begin to style our dataset.
Styling the layer
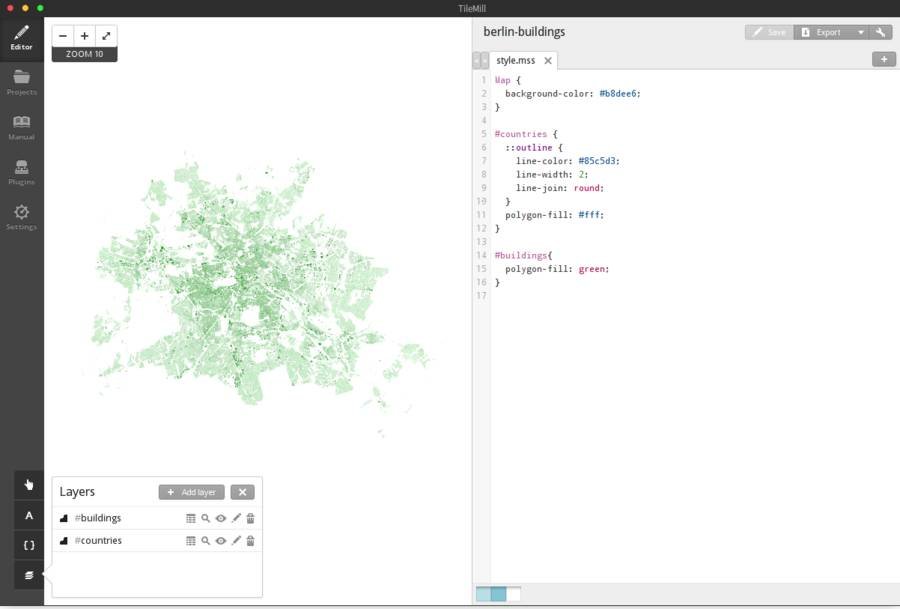
To see if everything works we colorize our shapefile by adding the following lines:
#buildings {polygon-fill: green;}
Because we gave our dataset the ID “buildings” when we added the new layer, we can now style it by using that ID. Your map should now look like this:
We can not only style the data but also explore it by using the layers button and and then the table button next the “buildings” dataset. For this example we want to visualize the floors column. Because we only want to style our data and not the whole world, we remove the countries style and set the map background black. Your CartoCSS should now look like this:
Map {background-color: black;}
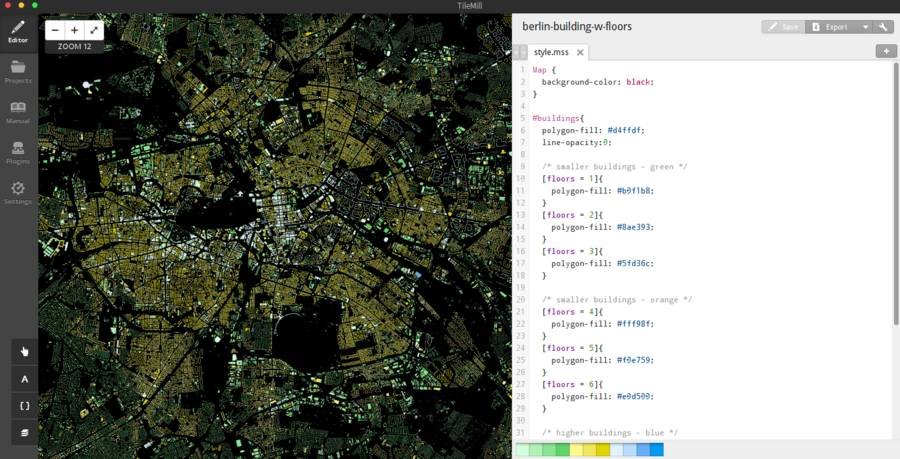
To style the floors column we can use its name and create conditions to colorize the certain areas. In this example the smaller buildings are green, the medium buildings are orange and the higher ones are blue. Feel free to play around with the conditions and colors (I used the Chroma.js Color Scale Helper to create the colors). This is only an example.
#buildings {polygon-fill: #d4ffdf;line-opacity: 0;/* smaller buildings - green */[floors='1'] {polygon-fill: #b0f1b8;}[floors='2'] {polygon-fill: #8ae393;}[floors='3'] {polygon-fill: #5fd36c;}/* smaller buildings - orange */[floors='4'] {polygon-fill: #fff98f;}[floors='5'] {polygon-fill: #f0e759;}[floors='6'] {polygon-fill: #e0d500;}/* higher buildings - blue */[floors >='7'] {polygon-fill: #def3ff;}[floors > 15] {polygon-fill: #bbdcfc;}[floors > 30] {polygon-fill: #65aef4;}[floors > 60] {polygon-fill: #0098f0;}}
Now you should see something like this:
Adding interactivity
In our final application we want to display a tooltip with the floor number of the buildings when we hover it. To enable this feature we have to click on the little hand in the bottom left corner and choose “Teaser”. Here we have to select “buildings” as the layer for interaction data and add the “floors” field to the “Content to be shown on hover” section as you see on the screenshot.
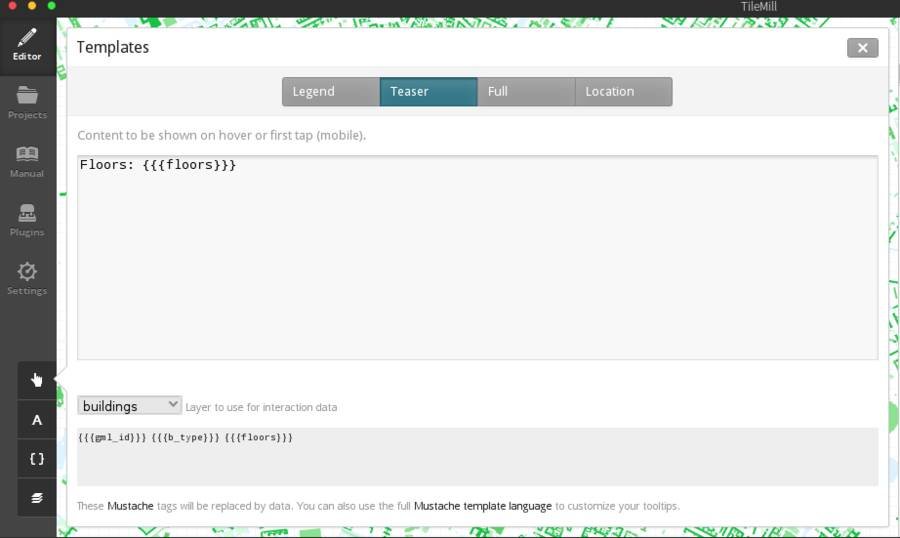
After saving the project you should see a box with the information when you are hovering a building.
Export as mbtiles
Before we export our layer, we set the map background to transparent, because we just want to create tiles with the data and nothing else.
Map {background-color: transparent;}
At the end your CartoCSS should look like this:
Map {background-color: transparent;}#buildings {polygon-fill: #d4ffdf;line-opacity: 0;/* smaller buildings - green */[floors='1'] {polygon-fill: #b0f1b8;}[floors='2'] {polygon-fill: #8ae393;}[floors='3'] {polygon-fill: #5fd36c;}/* smaller buildings - orange */[floors='4'] {polygon-fill: #fff98f;}[floors='5'] {polygon-fill: #f0e759;}[floors='6'] {polygon-fill: #e0d500;}/* higher buildings - blue */[floors >='7'] {polygon-fill: #def3ff;}[floors > 15] {polygon-fill: #bbdcfc;}[floors > 30] {polygon-fill: #65aef4;}[floors > 60] {polygon-fill: #0098f0;}}
To export your layer as mbtiles we have to click “export” in the top right corner and choose “MBTiles”. You have to wait until the data gets rendered. If you can’t spot the layer you can use this settings to export the map:
- Zoom: 9 - 13
- Center: 13.3944,52.5141,10
- Bounds: 13.0621,52.3475,13.7089,52.6734
On my machine it took 5 minutes to create the export. If it’s finished you can save the .mbtiles.
Upload to Mapbox
Take your exported .mbtiles file and upload it to your Mapbox account. After uploading the new layer you can find it under the “data” tab of your account. Now create a new project with that layer:
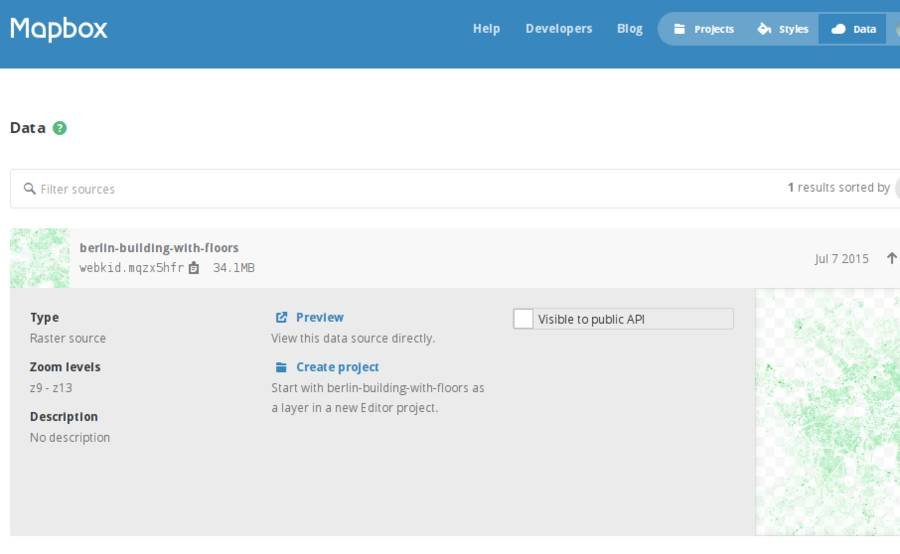
If you can’t see the map, use the search bar to jump to Berlin. Save the map and copy the map ID ( you can find under “Project” ->“Info”).
The web application
For displaying the map in a browser we are using Mapbox.js, because it already includes the grid layer functionality, we need to display the values of the floors. You could also use Leaflet in combination with the utfgrid Plugin.
See the Pen [Berlin Building Map](http://codepen.io/moklick/pen/pJLVMB/) by moklick ([@moklick](http://codepen.io/moklick)) on [CodePen](http://codepen.io).
To get started you can use this boilerplate code. It loads the map and shows the floor numbers in the console when you hover a building. Just change the access key and the map ID and you can start hacking.
<!DOCTYPE html><html><head><meta charset="utf-8" /><title>Map example</title><metaname="viewport"content="initial-scale=1,maximum-scale=1,user-scalable=no"/><script src="https://api.tiles.mapbox.com/mapbox.js/v2.2.1/mapbox.js"></script><linkhref="https://api.tiles.mapbox.com/mapbox.js/v2.2.1/mapbox.css"rel="stylesheet"/><style>* {margin: 0;padding: 0;}html,body {height: 100%;}#map {height: 100%;width: 100%;background: #111;}.building-info {position: absolute;left: 0.5em;top: 0.5em;color: white;font-size: 2.5em;font-family: Arial, sans-serif;}</style></head><body><div id="map"></div><div class="building-info"></div><script>L.mapbox.accessToken = 'your-access-token';var mapid = 'your-map-id';var infoElm = document.querySelector('.building-info');var map = L.mapbox.map('map', mapid, { gridLayer: false, zoomControl: false }).setView([52.5141, 13.3944, 10], 11);map.attributionControl.addAttribution('Source: Senatsverwaltung für Stadtentwicklung und Umwelt Berlin');var dataLayer = L.mapbox.gridLayer(mapid).addTo(map);dataLayer.on('mouseover', function (evt) {if (typeof evt.data === 'undefined') {return (infoElm.innerHTML = '');}infoElm.innerHTML = 'floors: ' + evt.data.floors;});</script></body></html>
Further Reading