In this article you can find an overview about different React mapping libraries. A lot of our projects are about data visualizations and maps. For two years we have been building most of our applications with React. At the beginning we just used Leaflet inside a React component. Now we are mostly using React Leaflet which is a React wrapper for Leaflet.
All examples included in this article can be found in the making-maps-with-react Github repo if you want to play around a bit.
WebGL Support
Before you start developing your map you should decide if you need WebGL support or not. You may consider using WebGL if you have a lot of features to be displayed at once, let's say 10k markers for example. For a normal map a library without WebGL support will be sufficient.
React Leaflet

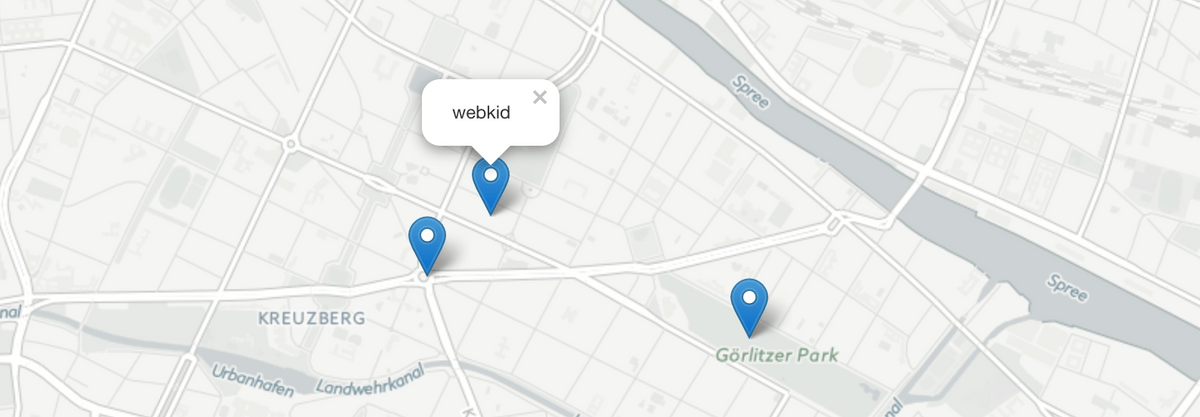
As mentioned earlier this is the library we use mostly. Leaflet is a very solid mapping library and this is the React wrapper. It's actively maintained and already uses Leaflet version ^1.0.0.
The API is fairly simple if you are used to the Leaflet API. The different components are well documented and there are already some nice third-party plugins. In order to see the map you also need to add
Leaflet.css. We are importing it in our main.styl file.Installation:
yarn add react-leaflet leaflet react react-dom
React Component:
You can find the full example in the Github repo.
class ReactLeafletMap extends PureComponent {render() {// create an array with marker componentsconst LeafletMarkers = markers.map((marker) => (<Marker position={marker.latlng} key={`marker_${marker.name}`}><Popup><span>{marker.name}</span></Popup></Marker>));return (<div className="map"><Mapcenter={mapConfig.center}zoom={mapConfig.zoom}className="map__reactleaflet"><TileLayerurl="https://cartodb-basemaps-{s}.global.ssl.fastly.net/light_all/{z}/{x}/{y}.png"attribution='© <a href="http://www.openstreetmap.org/copyright">OpenStreetMap</a>, © <a href="https://carto.com/attribution">CARTO</a>'/>{LeafletMarkers}</Map></div>);}}
Pigeon Maps

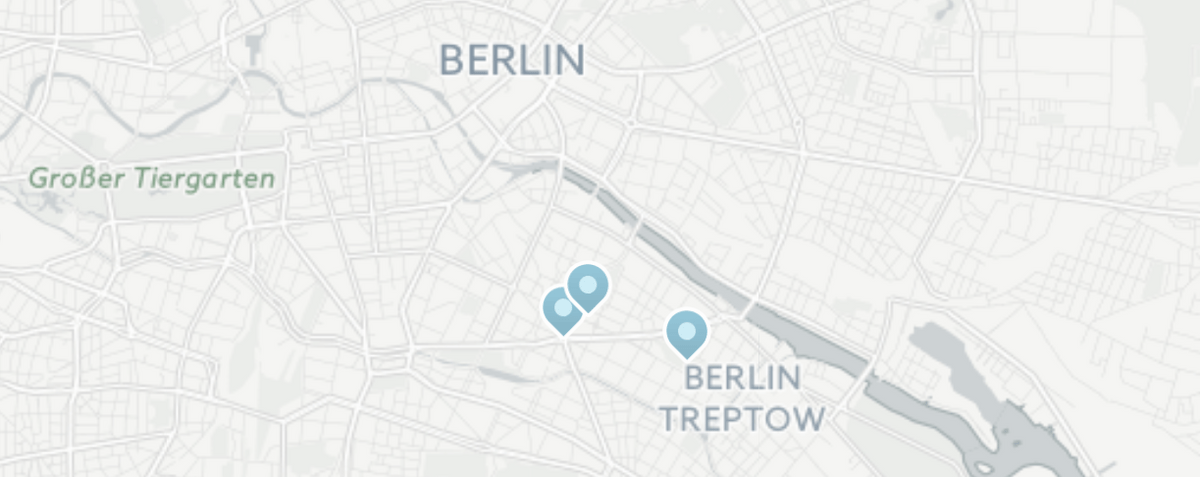
This is a very special mapping library because it has no external dependencies. For now you can only display overlays and markers on a basemap, so it could be useful for a very simple locator map. So far, there are no popups for the markers implemented so you would need to come up with your own logic. For more information, check out the project page.
Installation
yarn add pigeon-maps pigeon-marker
React Component:
You can find the full example in the Github repo.
class PigeonMaps extends PureComponent {onMarkerClick(evt) {console.log(evt.payload);}render() {// create an array with marker componentsconst PigeonMarkers = markers.map((marker) => (<Markerkey={`marker_${marker.name}`}anchor={marker.latlng}payload={marker.name}onClick={this.onMarkerClick}/>));return (<div className="map"><Mapwidth={window.innerWidth}height={600}defaultCenter={mapConfig.center}defaultZoom={mapConfig.zoom}provider={getProvider}>{PigeonMarkers}</Map></div>);}}
Google Map React

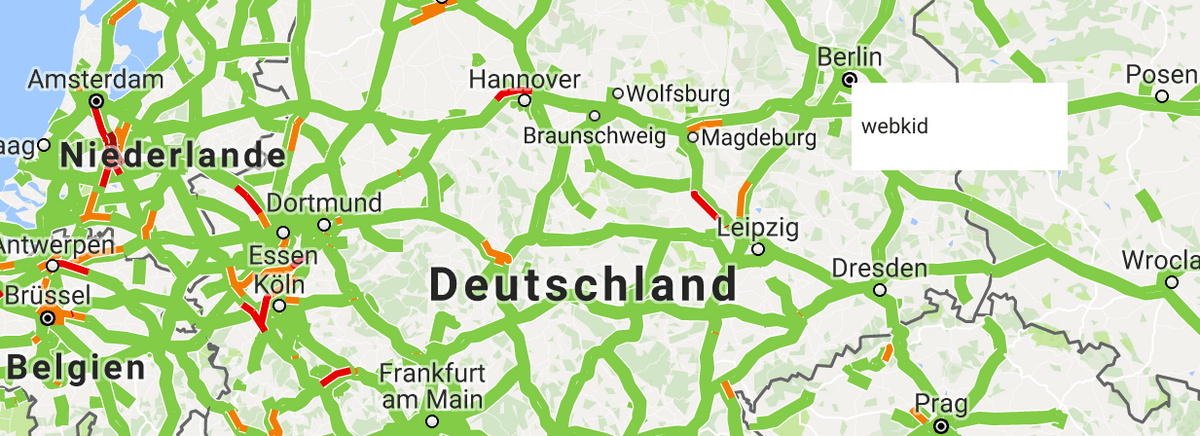
The Google Map React library wraps your Google map as a React component. The cool thing about it is that it lets you render any React component into the map, which gives you the opportunity to easily create custom markers. Another useful feature is that the components provided by the Google Maps API (for example Traffic or Transit layers or a searchbox) can be included in the map as well.
Make sure to include your Google Maps API key. The setup is very straight forward:
Installation:
yarn add google-map-react react
React Component:
The full example is available in the Github repo.
const CustomMarker = ({ text }) => (<div className="custom-marker"><p>{text}</p></div>);class GoogleMapReactComponent extends PureComponent {render() {const GoogleMapsMarkers = markers.map((marker) => (<CustomMarkerkey={`marker_${marker.name}`}lat={marker.latlng[0]}lng={marker.latlng[1]}text={marker.name}/>));return (<GoogleMapReactdefaultCenter={mapConfig.center}defaultZoom={mapConfig.zoom}layerTypes={['TrafficLayer', 'TransitLayer']}bootstrapURLKeys={{key: CONFIG.GOOGLE_MAPS_API_KEY,language: 'de',}}>{GoogleMapsMarkers}</GoogleMapReact>);}}
React MapGL

If you need WebGL support for your project, you might consider using React MapGL. This is a react wrapper for Mapbox GL which uses WebGL to render maps from vector tiles.
The library has a small API and some sample overlays like scatterplot. Other useful overlays are provided e.g by deck.gl. As an example we set up a simple map using the scatterplot overlay. In the next section you can find a version that uses deck.gl.
The setup is a little tricky and the docs seem to be a bit confusing because the readme of the repo and the docs are different. Note that it is necessary to install immutable and provide an Mapbox API key to get started.
Installation:
yarn add react-map-gl immutable react react-dom
React Component:
You can find the full example in the Github repo.
class ReactMapGL extends PureComponent {constructor(props) {super(props);this.state = {viewport: {width: window.innerWidth,height: 600,latitude: mapConfig.center[0],longitude: mapConfig.center[1],zoom: mapConfig.zoom,isDragging: false,startDragLngLat: mapConfig.center,pitch: 50,bearing: 0,},};this.onChangeViewport = this.onChangeViewport.bind(this);}onChangeViewport(viewport) {this.setState({viewport: { ...this.state.viewport, ...viewport },});}render() {const { viewport } = this.state;return (<div className="reactmapgl"><MapGL{...viewport}mapboxApiAccessToken={CONFIG.MAPBOX_ACCESS_TOKEN}perspectiveEnabledonChangeViewport={this.onChangeViewport}><ScatterplotOverlay{...viewport}locations={locations}dotRadius={2}globalOpacity={1}compositeOperation="screen"dotFill="#1FBAD6"renderWhileDragging/></MapGL></div>);}}
React MapGL with Deck.GL:

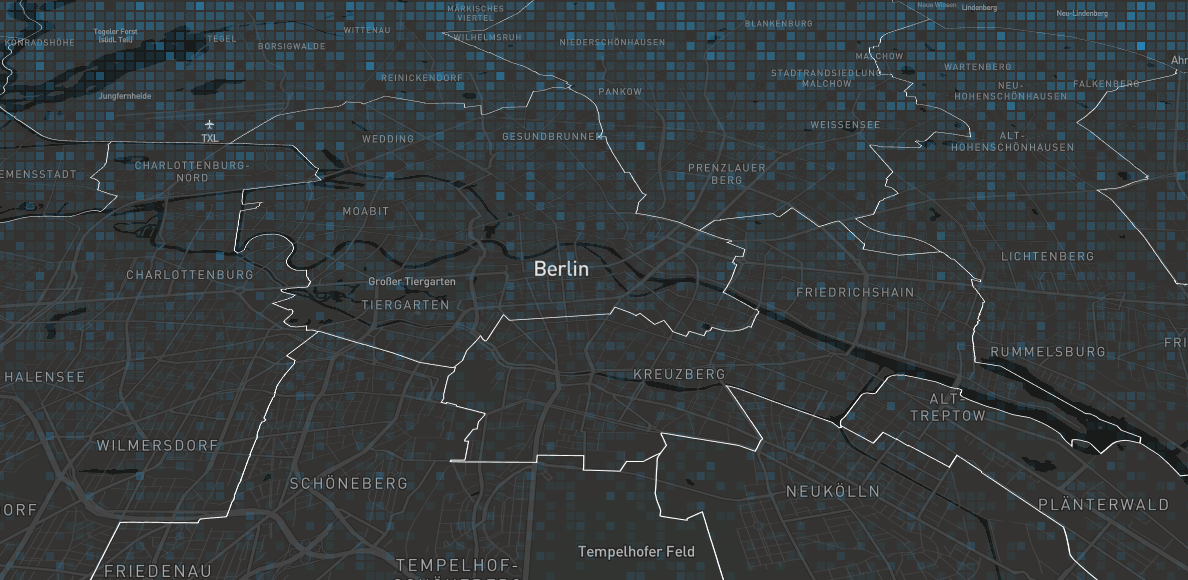
Deck.GL was developed by the uber team and is a framework which provides beautiful overlays for maps rendered with Mapbox GL. On the website of the project you will find a tutorial that shows how to implement different layers in your map. The example below uses the GeoJsonLayer and ScreenGridLayer (with 50.000 points).
Installation:
yarn add react-map-gl immutable react react-dom deck.gl luma.gl
React Component:
You can find the full example in the Github repo.
class ReactMapGLDeckGL extends PureComponent {constructor(props) {super(props);this.state = {viewport: {width: window.innerWidth,height: 600,latitude: mapConfig.center[0],longitude: mapConfig.center[1],zoom: mapConfig.zoom,isDragging: false,startDragLngLat: mapConfig.center,pitch: 50,bearing: 0,},geojson: null,};requestJson('data/berlin_bezirke.json', (error, response) => {if (!error) {this.setState({ geojson: response });}});this.onChangeViewport = this.onChangeViewport.bind(this);}onChangeViewport(viewport) {this.setState({viewport: { ...this.state.viewport, ...viewport },});}initialize(gl) {gl.blendFuncSeparate(gl.SRC_ALPHA, gl.ONE, gl.ONE_MINUS_DST_ALPHA, gl.ONE);gl.blendEquation(gl.FUNC_ADD);}render() {const { viewport, geojson } = this.state;const geosjsonLayer = new GeoJsonLayer({id: 'geojson-layer',data: geojson,filled: false,stroked: true,lineWidthMinPixels: 1,lineWidthScale: 1,getLineColor: (d) => [175, 175, 175],});const screenGridLayer = new ScreenGridLayer({id: 'screen-grid-layer',data: scatterPlotData,cellSizePixels: 10,minColor: [43, 140, 190, 0],maxColor: [43, 140, 190, 255],});return (<div className="reactmapgldeckgl"><MapGL{...viewport}mapboxApiAccessToken={CONFIG.MAPBOX_ACCESS_TOKEN}mapStyle="mapbox://styles/mapbox/dark-v9"perspectiveEnabledonChangeViewport={this.onChangeViewport}><DeckGL{...viewport}layers={[geosjsonLayer, screenGridLayer]}onWebGLInitialized={this.initialize}/></MapGL></div>);}}
Further Reading
