Data Visualization
– March 11, 2016
Using Spreadsheets as a CMS for data visualizations

Christopher Möller
@chrtze
When we build visualizations at webkid.io, we sometimes need small backends for our applications which enable our clients to change data after launch. This is especially useful when the app should update automatically. It also makes collaboration on data a lot easier.
For this purpose, we rely on spreadsheets most of the time, as they are easy to use for entering data as well as getting structured data out of them. There are different ways for putting the data into your frontend, which we will explain in this article.
Tabletop.js
Tabletop is a JavaScript library that you can use for fetching data from Google Spreadsheets. For testing purposes, I create an example spreadsheet at drive.google.com and enter some test values.
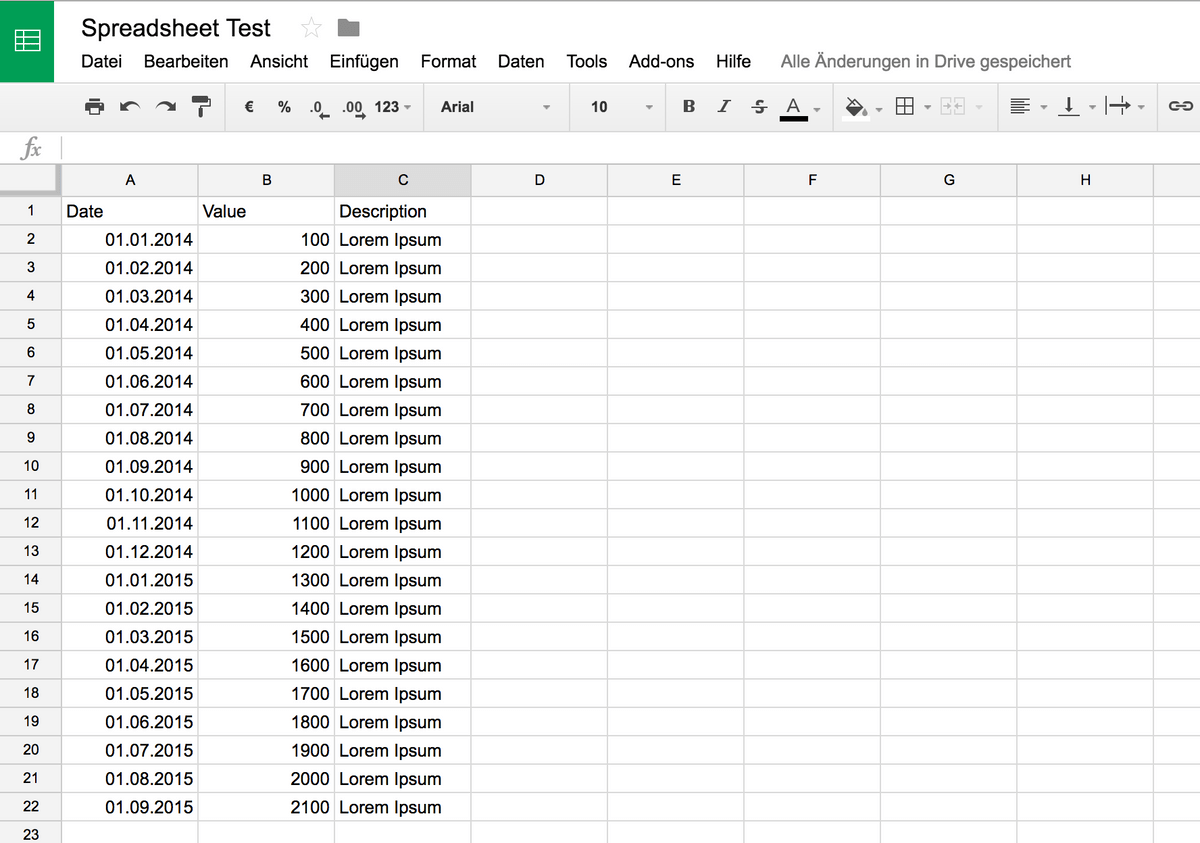
Once you filled in some data, you have to make the dataset public to allow Tabletop making requests to it.
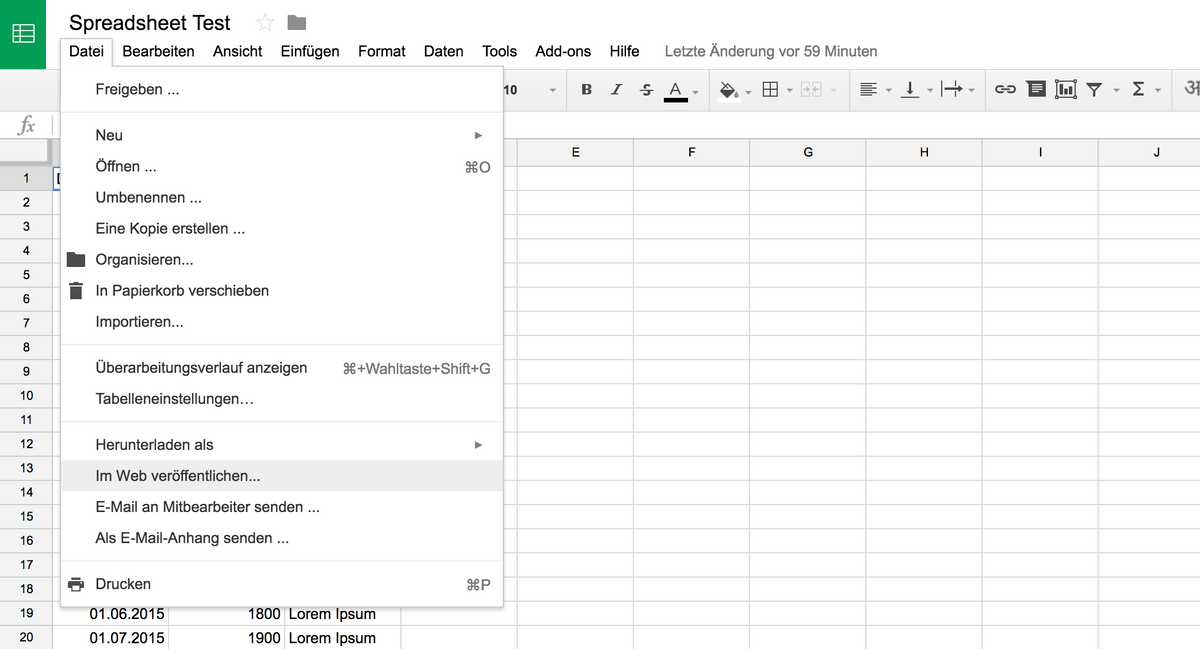
Now as we have a dataset, we will fetch the data with the help of nodejs. You could also run this example in the browser.
const Tabletop = require('tabletop');Tabletop.init({key: '1R6nHAcmjHhT6UHgj7gKKuxSadYV_HyaFWoU13cadavs',callback: (data, tabletop) => {console.log(data);},simpleSheet: true,});
The script will simply get the data from the spreadsheet and print its content to the console. You can see that Tabletop returns the data as JSON so that you can use it easily for creating a visualization.
# example output[ { Date: '01.01.2014', Value: '100', Description: 'Lorem Ipsum' },{ Date: '01.02.2014', Value: '200', Description: 'Lorem Ipsum' },{ Date: '01.03.2014', Value: '300', Description: 'Lorem Ipsum' },{ Date: '01.04.2014', Value: '400', Description: 'Lorem Ipsum' },{ Date: '01.05.2014', Value: '500', Description: 'Lorem Ipsum' },{ Date: '01.06.2014', Value: '600', Description: 'Lorem Ipsum' },{ Date: '01.07.2014', Value: '700', Description: 'Lorem Ipsum' },{ Date: '01.08.2014', Value: '800', Description: 'Lorem Ipsum' },{ Date: '01.09.2014', Value: '900', Description: 'Lorem Ipsum' },{ Date: '01.10.2014', Value: '1000', Description: 'Lorem Ipsum' },{ Date: '01.11.2014', Value: '1100', Description: 'Lorem Ipsum' },{ Date: '01.12.2014', Value: '1200', Description: 'Lorem Ipsum' },{ Date: '01.01.2015', Value: '1300', Description: 'Lorem Ipsum' },{ Date: '01.02.2015', Value: '1400', Description: 'Lorem Ipsum' },{ Date: '01.03.2015', Value: '1500', Description: 'Lorem Ipsum' },{ Date: '01.04.2015', Value: '1600', Description: 'Lorem Ipsum' },{ Date: '01.05.2015', Value: '1700', Description: 'Lorem Ipsum' },{ Date: '01.06.2015', Value: '1800', Description: 'Lorem Ipsum' },{ Date: '01.07.2015', Value: '1900', Description: 'Lorem Ipsum' },{ Date: '01.08.2015', Value: '2000', Description: 'Lorem Ipsum' },{ Date: '01.09.2015', Value: '2100', Description: 'Lorem Ipsum' } ]
Sheetsu
Sheetsu is kind of similar to Tabletop - but instead of using it as a JavaScript-library, it offers a service that turns a Google spreadsheet into a REST-API that you can request from your application.
I am using the same spreadsheet as above and entering its url into the Sheetsu interface:

Now that the API-URL was generated by Sheetsu you can see that it returns our example dataset as JSON.

In your application, you could now request the dataset, for example by using jQuery:
$.getJSON('https://sheetsu.com/apis/381554f4', (data) => console.log(data));
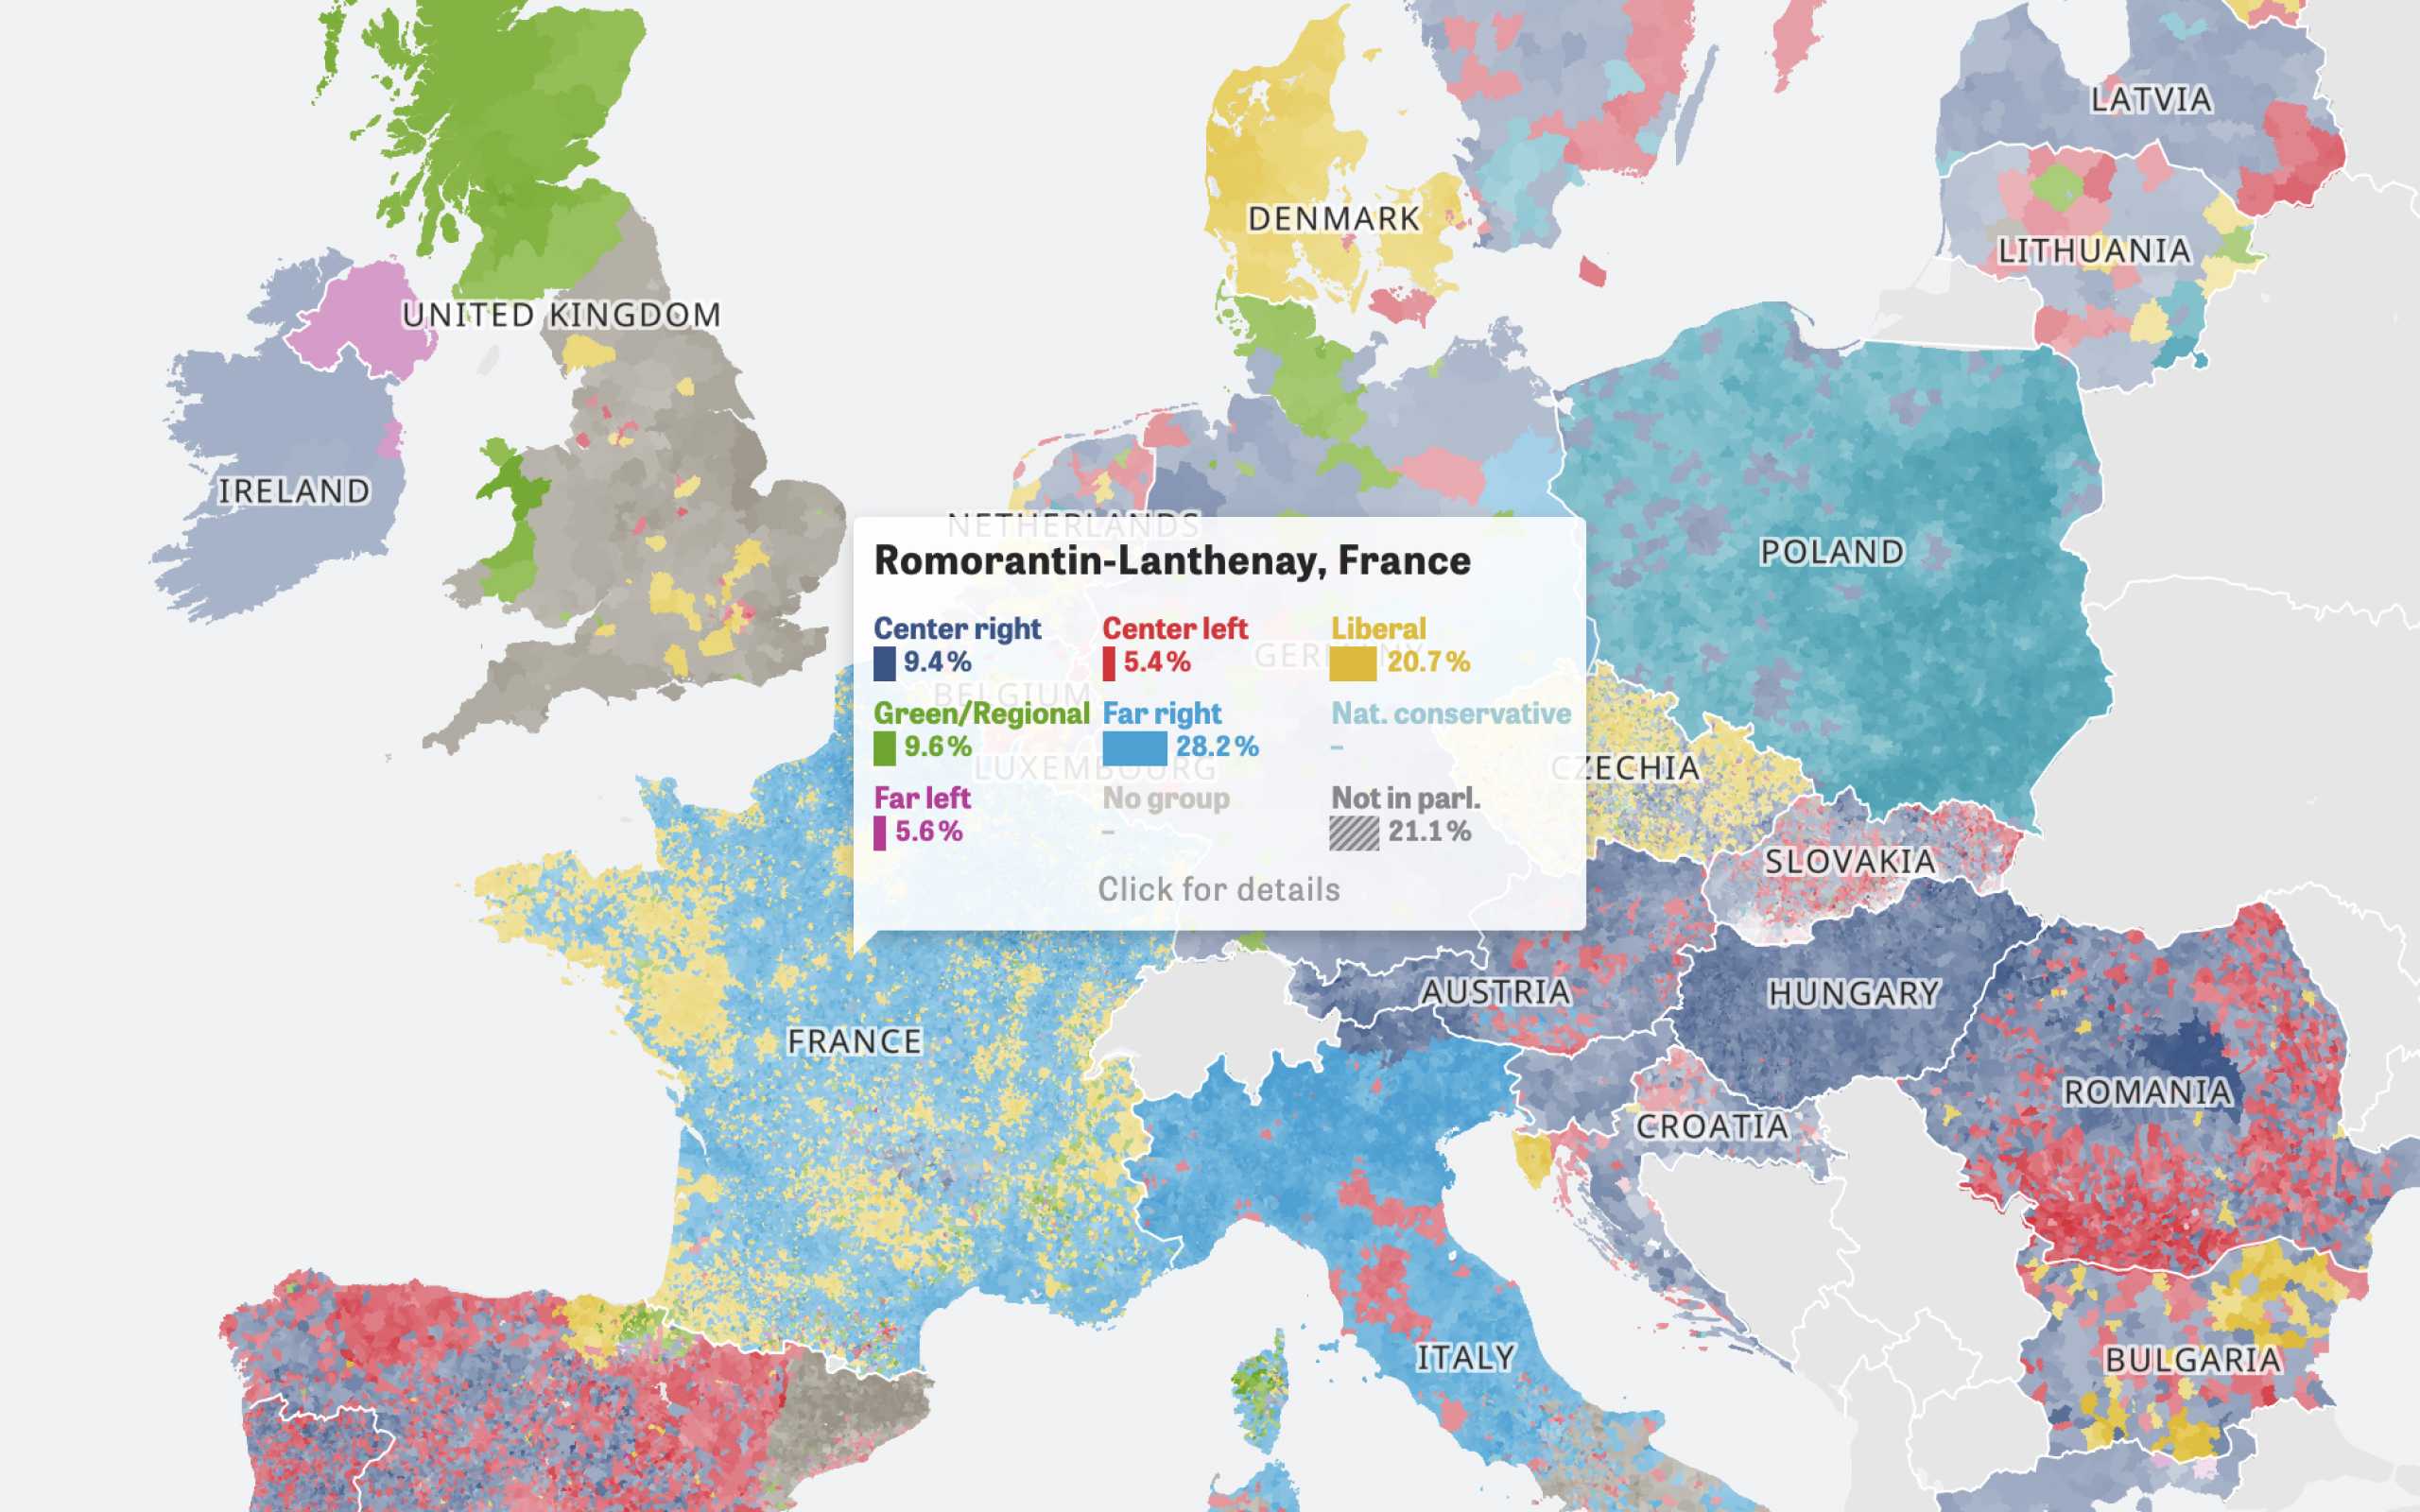
Colors Of Europe
Interactive Data Visualization (Zeit Online)
Are you interested in a collaboration?
We are specialized in creating custom data visualizations and web-based tools.
Flatsheet / EditData

Flatsheet has not been released, yet, but its concept looks quite promising. You can use an earlier version of Flatsheet at editdata.org.
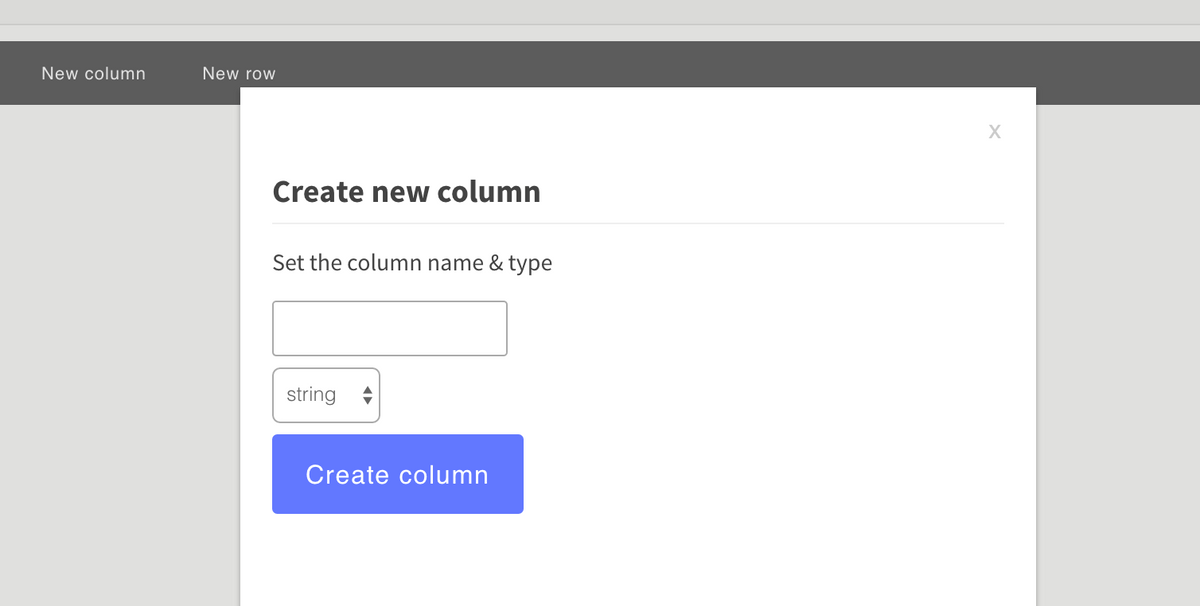
Once you open EditData, you have several options. You could start with an empty dataset or upload an existing one.
The editing process is kind of slow, as you have to add rows and columns manually. After entering some data, you can download the dataset. Hopefully, flatsheet will offer an Api to directly get the data into our applications.
Fieldbook

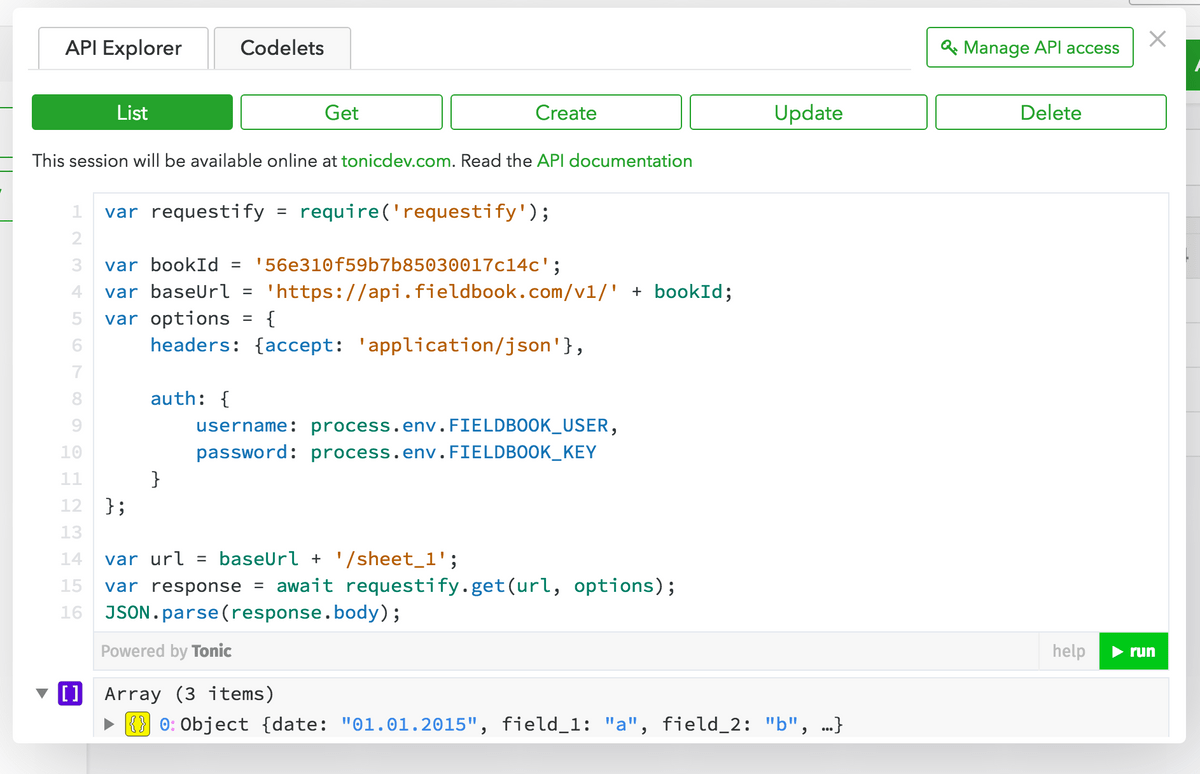
With Fieldbook you get an online editor for your data, similar to Google Spreadsheets. It is a bit more sophisticated and could be used for more complex datasets as well. The API might be useful when your application need a lot of data that has a nested structure.
Gridspree

http://gridspree.io/ offers a small JavaScript library that you can use in your frontend. This enables you to write moustache-like templates for displaying the data.
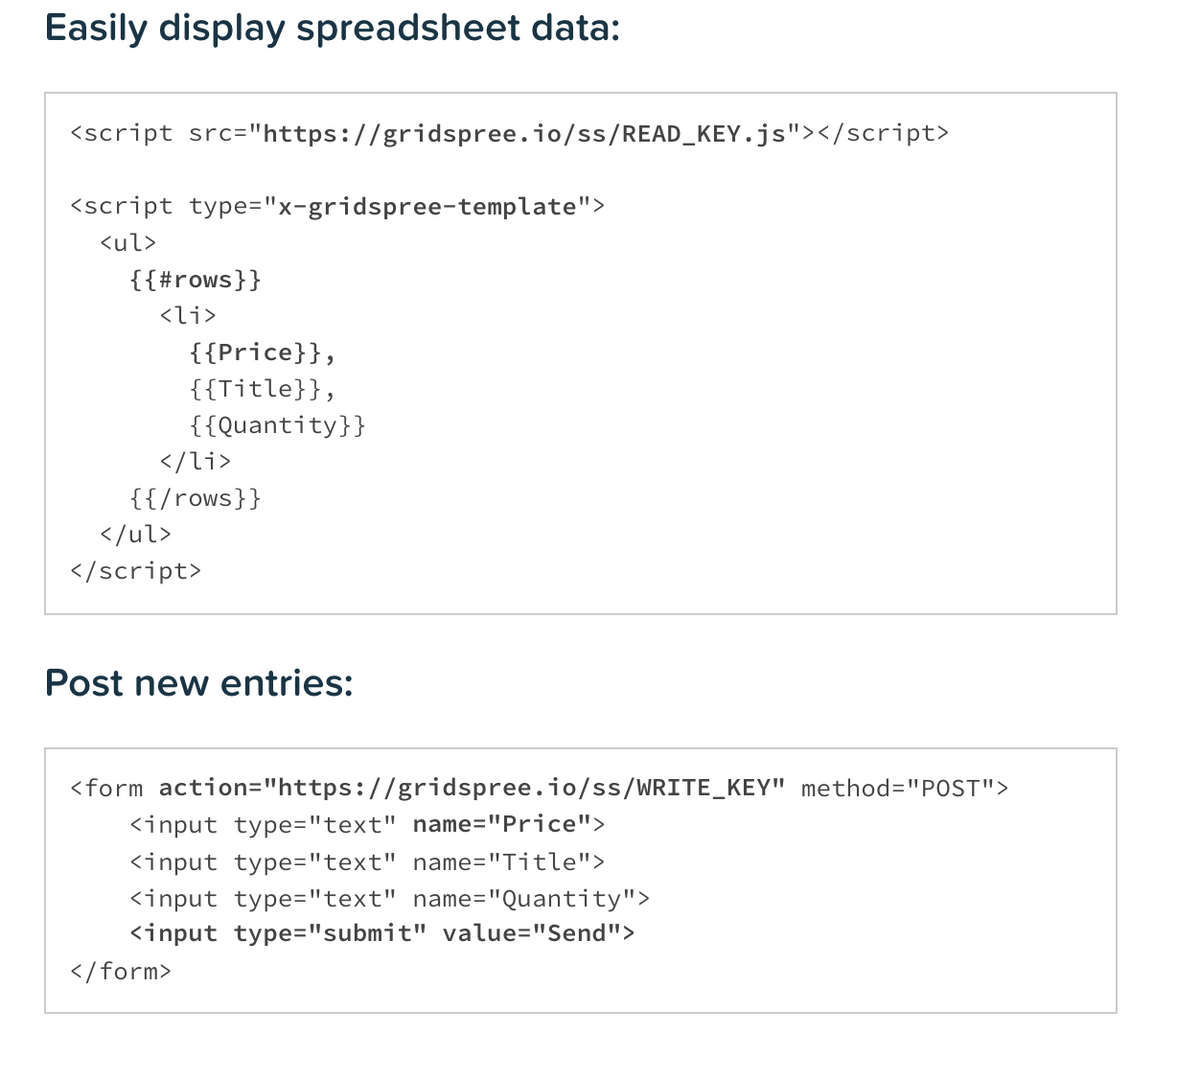
It has some limitations on API calls - you can only have 1000 calls per month atm.
Further Reading