Data Visualization
– July 26, 2017
Visualization of data along public transportation lines in Berlin

webkid
@webk1d

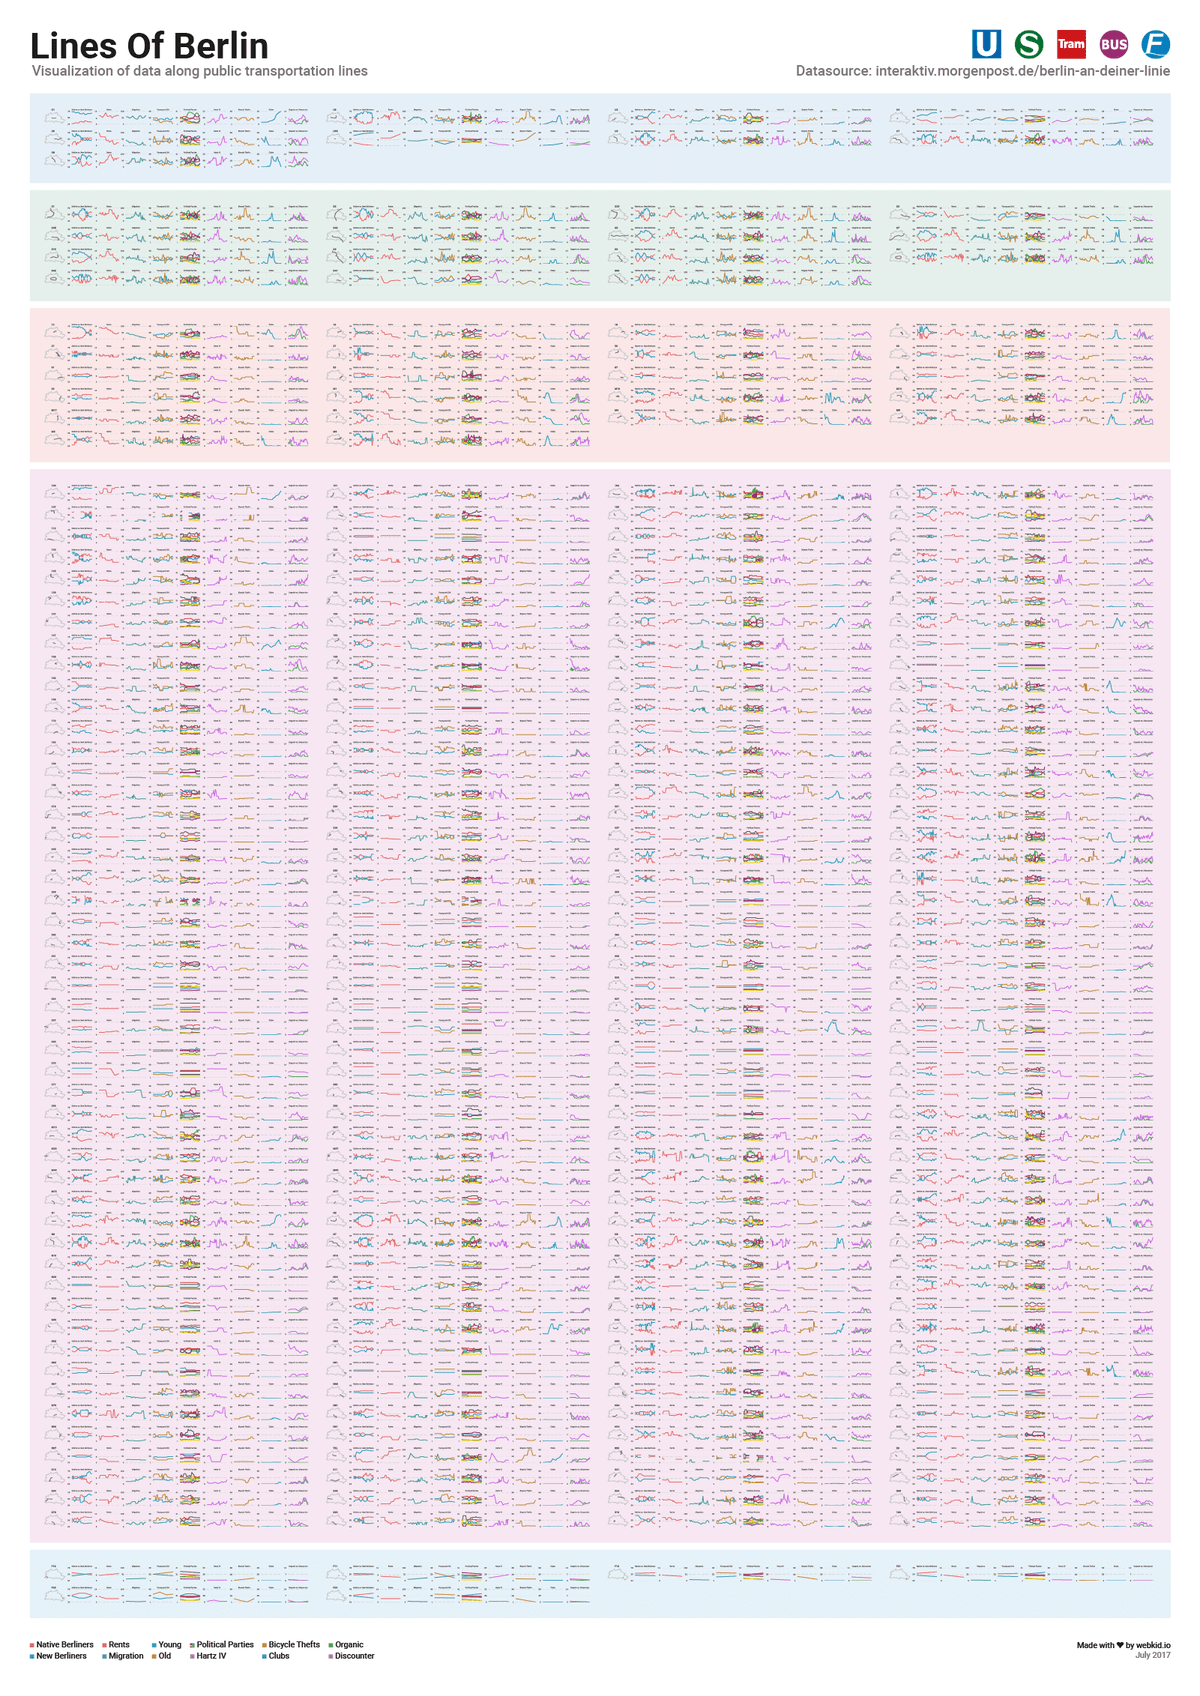
In our latest project "Berlin an deiner Linie" with the Interactive Team of the Berliner Morgenpost we visualized data along 250 public transportation lines in Berlin. You can choose between 250 lines including busses, metros, trams, trains and even ferries and explore categories like voting behavior, average age and crime rate for each station.
To give you an idea of how big the dataset is, that we used for this project, we visualized all the data on one giant poster. Have fun with this massive small multiple data overkill!
Further Reading