Berliner Morgenpost
How Old Is Berlin?
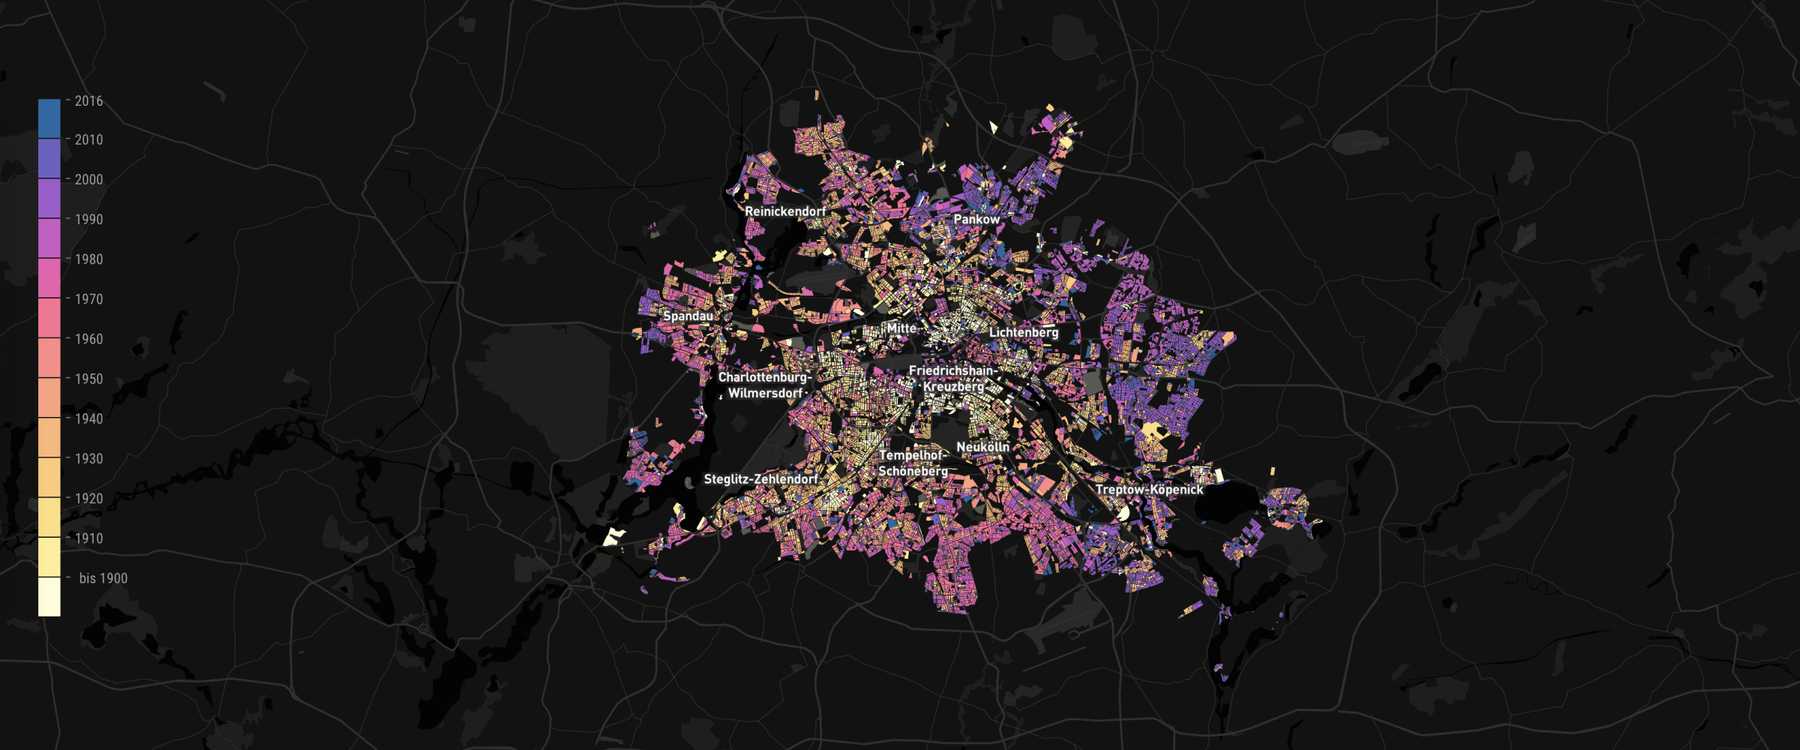
This interactive map lets you scroll through the history of Berlin by visualizing the year of construction for every single building in the city
Tasks
Frontend development
Data processing
Map styling
Performance optimization
Team
Christopher Möller
André Pätzold
Marie-Louise Timcke
David Wendler
Published
2018/05/23
Links
During our long-term cooperation with the Berliner Morgenpost, we have worked on numerous interactive maps that visualize various indicators of the city. Among them were a rental map, that shows how expensive it is to live in the city center, a noisemap that was generated from scientific data about noise levels and an election map that visualized how Berliners voted in the latest election.
One of the reasons why it is possible to create all kinds of maps about Berlin is that the city is regularly publishing datasets as open data. One of the released datasets is a shapefile with all building blocks of Berlin and their average age. This geodata was used as a basis for our interactive "How Old Is Berlin?".

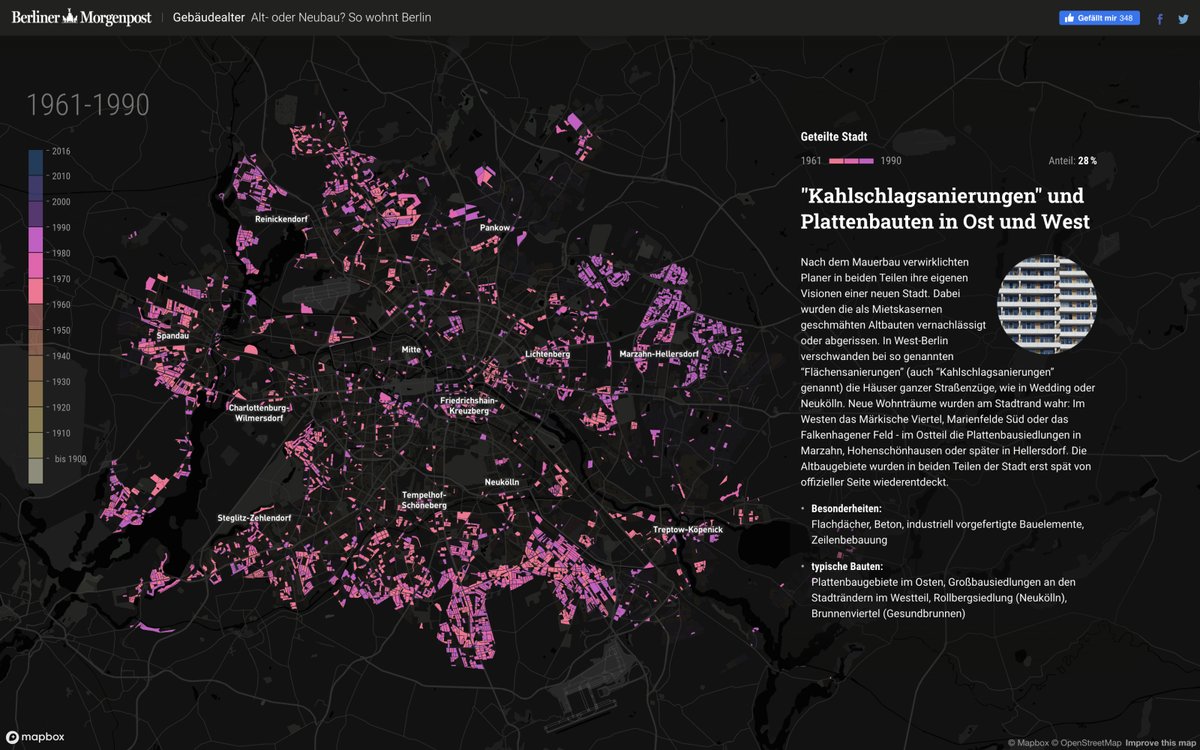
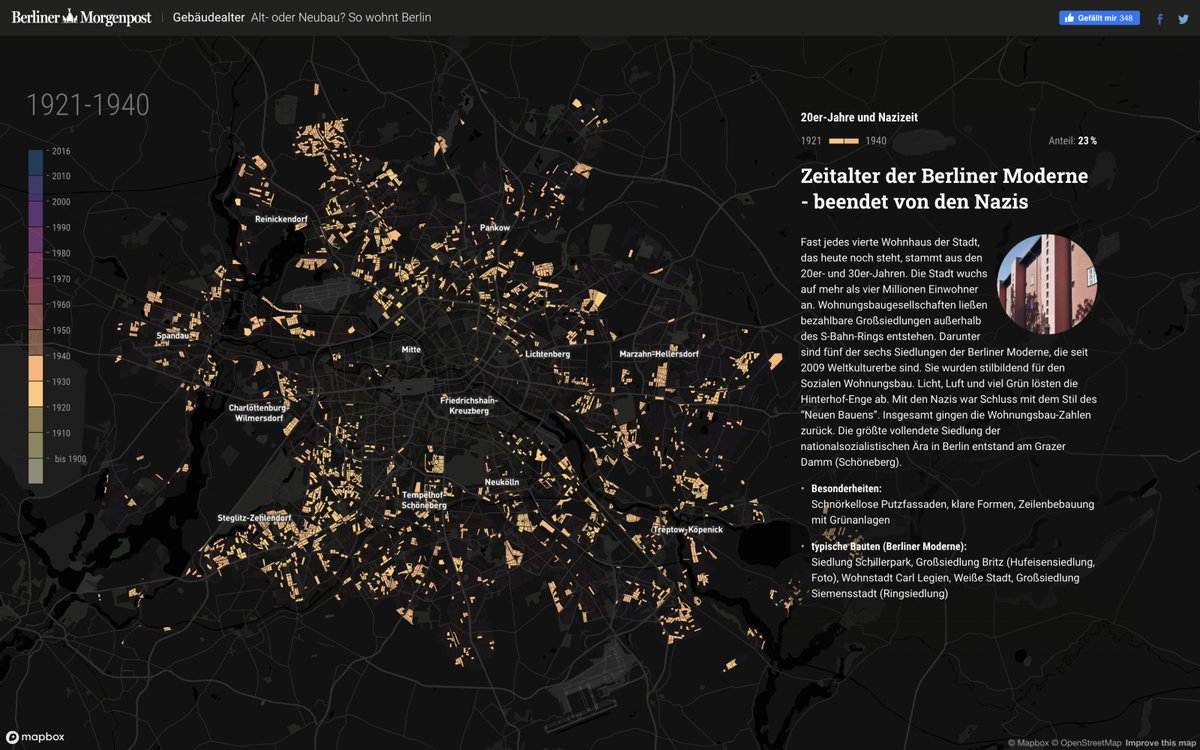
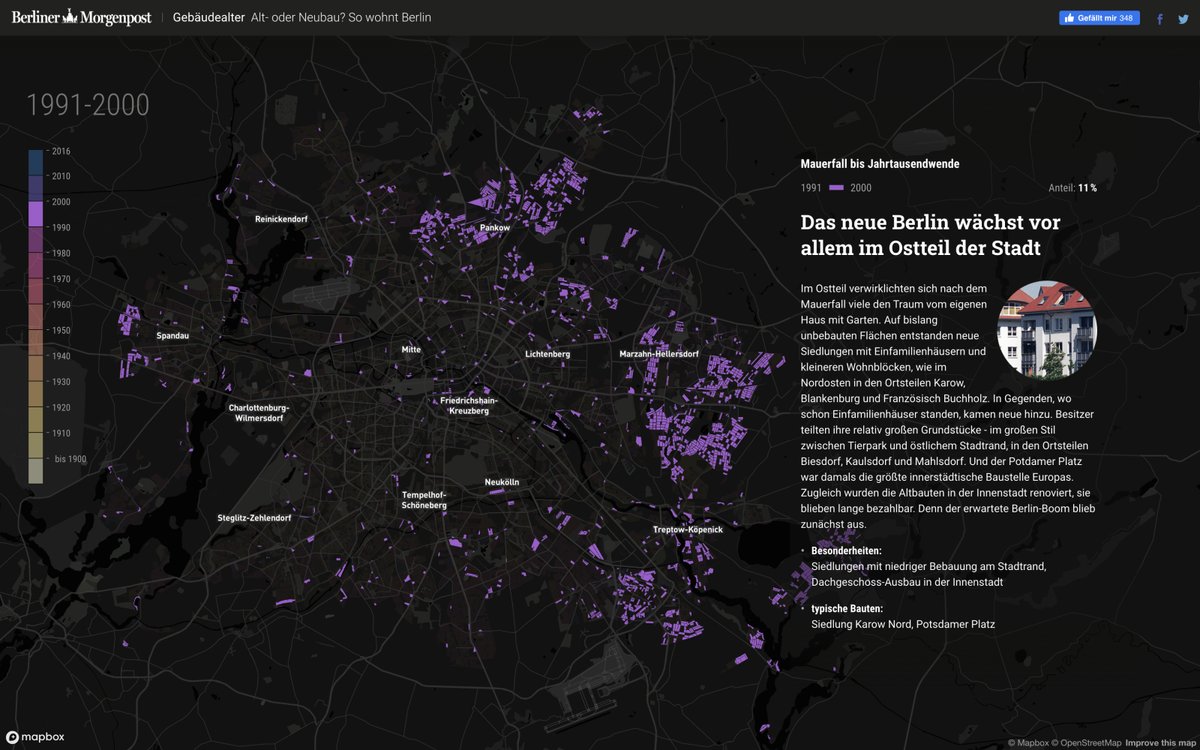
The general idea for the story was to provide some historical context to the current cityscape of Berlin. The article was supposed to be easy to understand and should not bore the reader with too much historical details. We finally decided to develop a scroll-story which lets the user scroll through different epochs of Berlin's history. While scrolling, the map remains rather static and is animated between the individual layers.

In addition to the main story, the user can enter an address or explore the interactive version of the map. That interactive version features a tooltip and lets the user get information for every building in Berlin.

For the technical implementation, the main challenge was to create a smooth transition between the different layers in the story. This was solved by using mapbox-gl with filters while scrolling through the story points.
Technology Stack
QGIS
MapboxGL
Chroma.js
Are you interested in a collaboration?
Contact us
Featured Projects