DataDesign
Sustainable Development Goals
Several data visualizations that explore the connections between climate actions and sustainable development goals
Tasks
Frontend Development
Data Visualization
Team
Stefan Keil
Moritz Klack
Sebastian Sadowski
Giuseppe Di Vincenzo
and more...
Published
2017/11/7
Links
Together with the DataDesign Studio we developed multiple interactive visualizations that show the connections between the Paris Agreement and the 2030 Agenda for Sustainable Development.
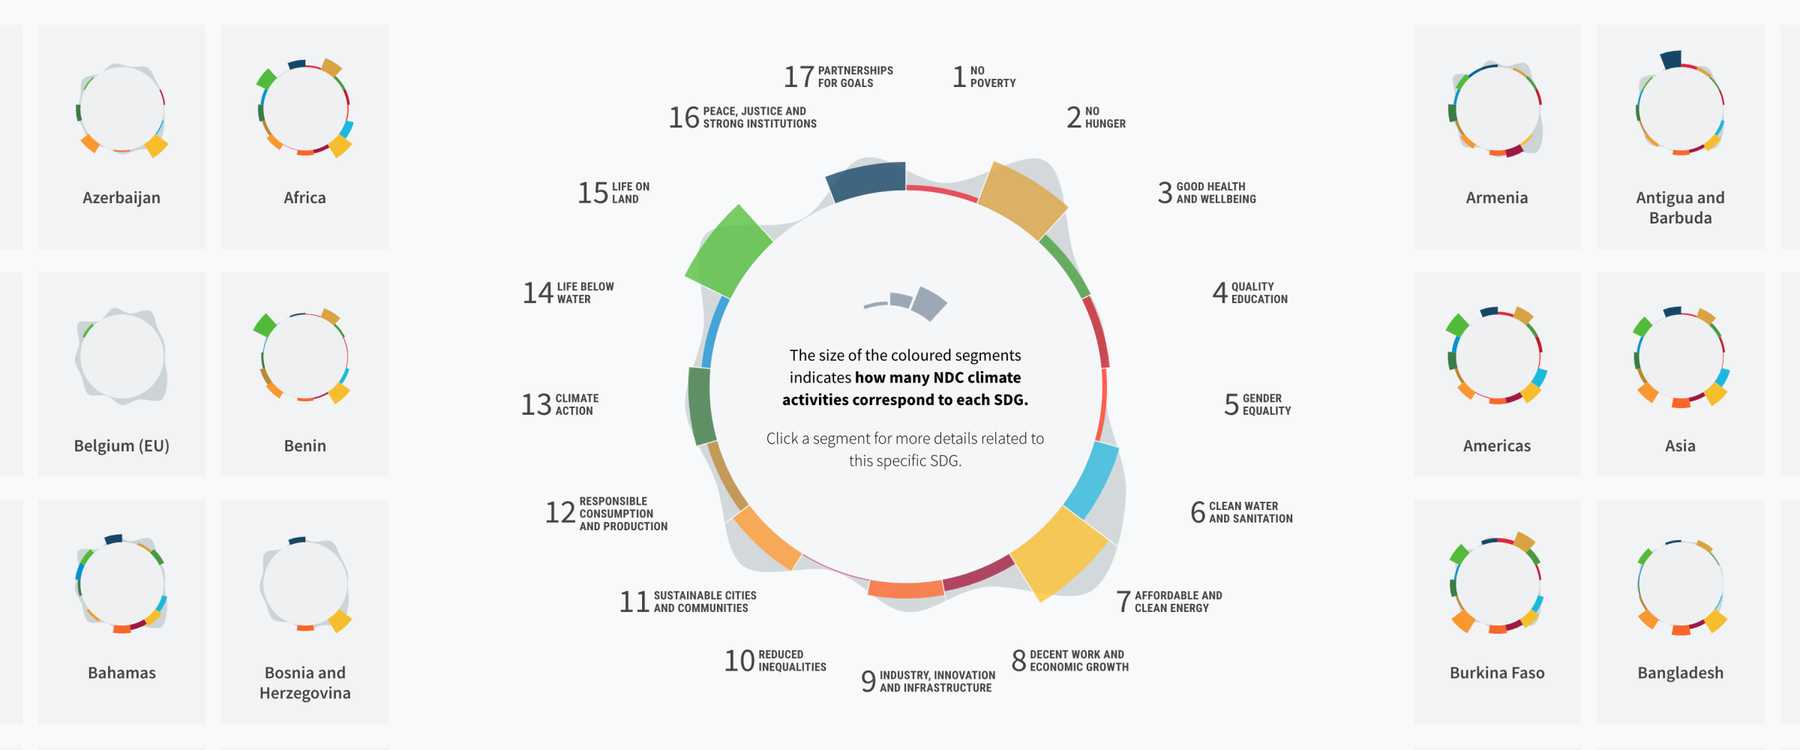
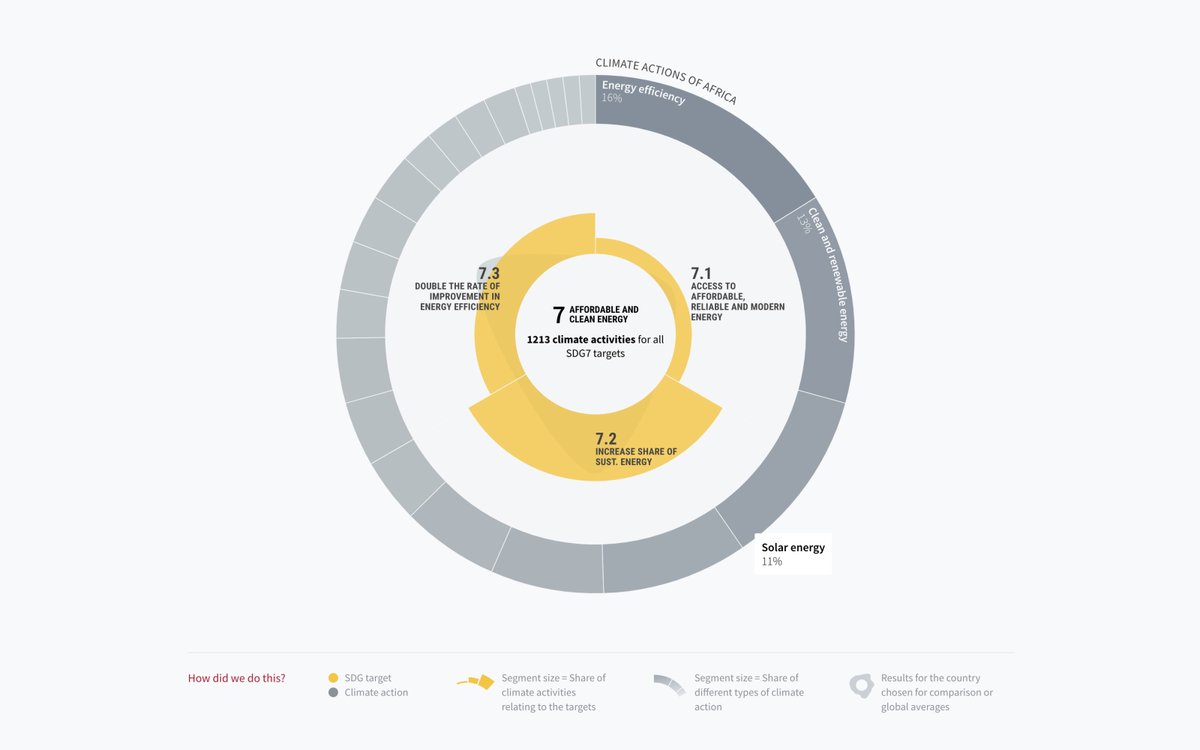
The charts that were designed by Sebastian Sadowski of DataDesign Studio, are different kinds of interactive radial charts that enable the users to explore all connections in great detail.

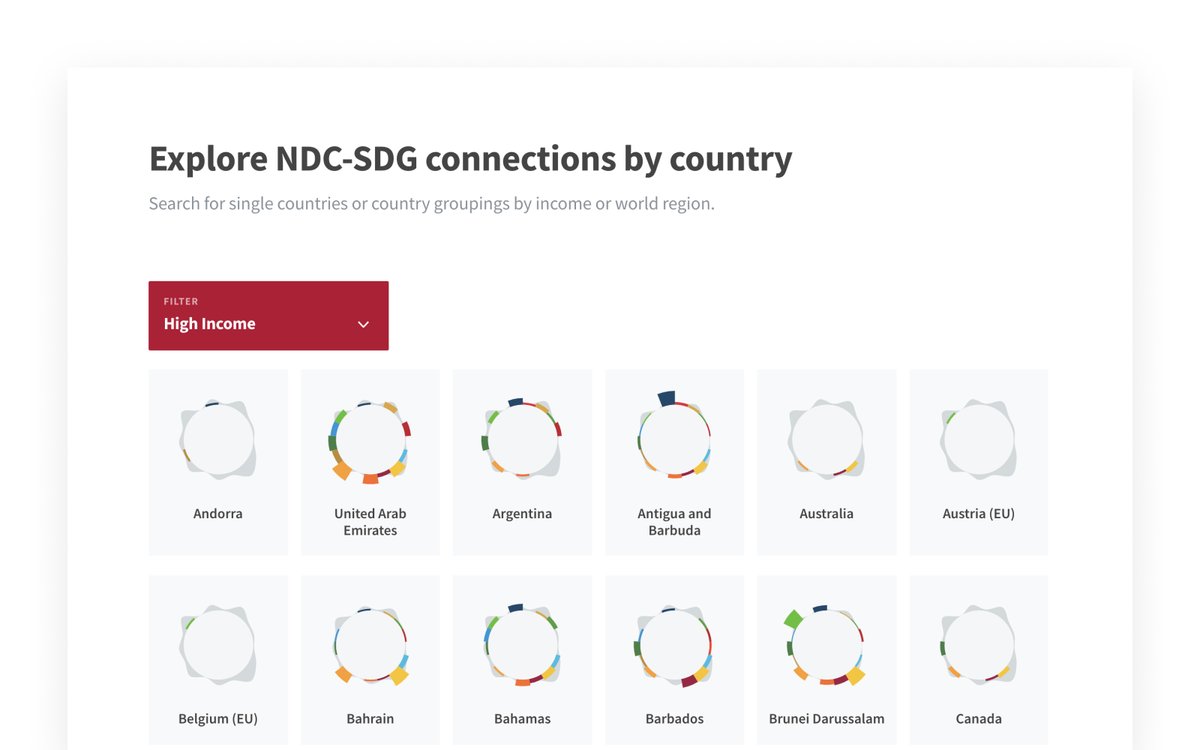
On the overview level, every country has its own chart that shows its particular climate activities and to which sustainable development goal it relates. In addition to the overview charts, a more sophisticated radial chart was developed for showing a higher level of detail. The radial chart visualizes the activities for each individual country or region and for each individual activity.

For the same level of detail, a dashboard-like view on the data was implemented as well. This additional view summarizes general findings for each SDG and thus completes the detailed analysis of the connection of SDGs and NDCs.
Technology Stack
React.js
D3
Are you interested in a collaboration?
Contact us
Featured Projects