FragDenStaat
Berlin Demonstrations
An interactive bubble chart that lets you explore every single demonstration that was taking place in Berlin since 2018
Tasks
Design
Frontend Development
Data Visualization
Team
Fabian Dinklage
Moritz Klack
Christopher Möller
Arne Semsrott
Published
2020/10/28
Links
With an average of 14 demonstrations per day, Berlin is the protest capital of Germany. For the first time, data about these demonstrations has been obtained and made publicly by FragDenStaat, a german freedom of information platform. The dataset, which has been requested from the Police contains 12,774 registered events in total.
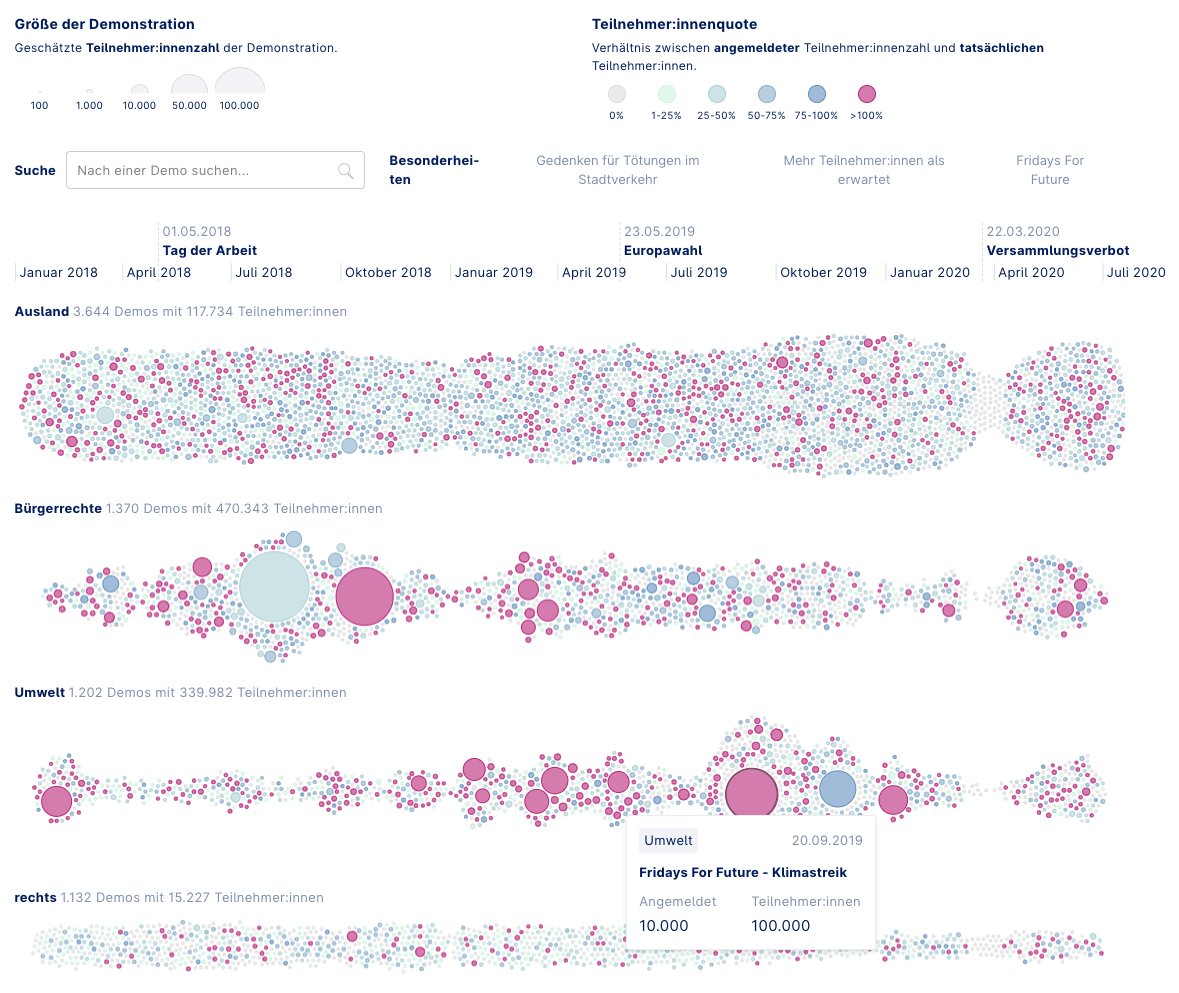
Our main goal for building a visualization was to show a timeline of protests to find out which topics have been the most important. It was also necessary for us to show every single demonstration to give the users the possiblity to explore the dataset on a high level of detail.

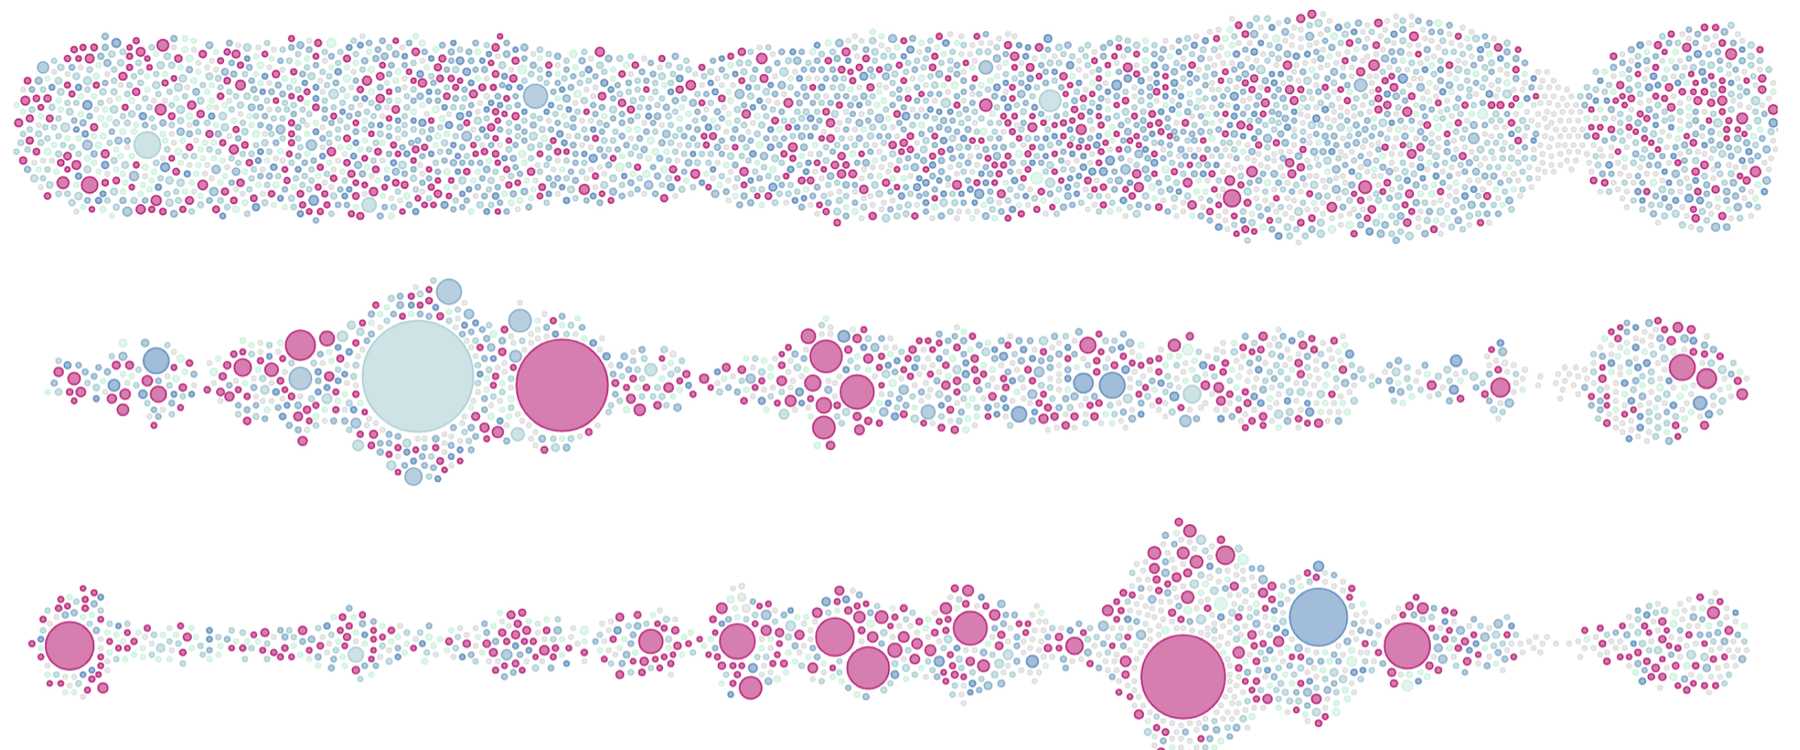
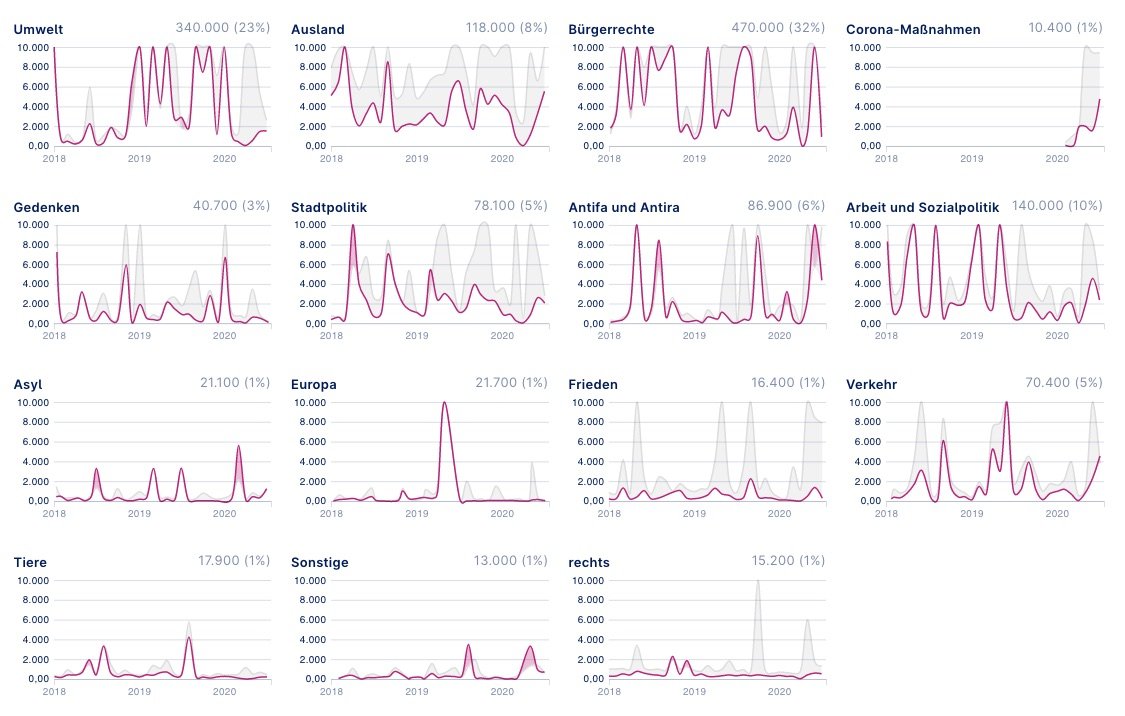
The result are two visualizations: An interactive bubble chart that shows every single demonstration on a timeline and a small multiples linechart visualization that shows the actual number of participants over time.
For building the bubble chart, we precomputed the positions of the bubbles for different screen sizes using a d3-force layout. For adding interactivity, we built a search function, filters and a tooltip.

The second visualization, a small multiples line chart, shows the number of participants for every month and category. It also highlights the topics which had more participants than expected.
Technology Stack
React
d3-force
NodeJS
Are you interested in a collaboration?
Contact us
Featured Projects