Zeit Online
The New Colors of Europe
A very detailed interactive map showing how 80,000 regions have voted in the 2019 European election
Tasks
Data processing
Map styling
Frontend development
Tile hosting
Team
Paul Blickle
Christopher Möller
Arnold Platon
Michael Schlieben
and more...
Published
2019/07/02
Links
Between May 23 and 26, 2019 the current European Parliament was elected. Some days after the election, Zeit Online gathered a dataset which contained the geometries and election results of all 78,818 municipalities that had voted.
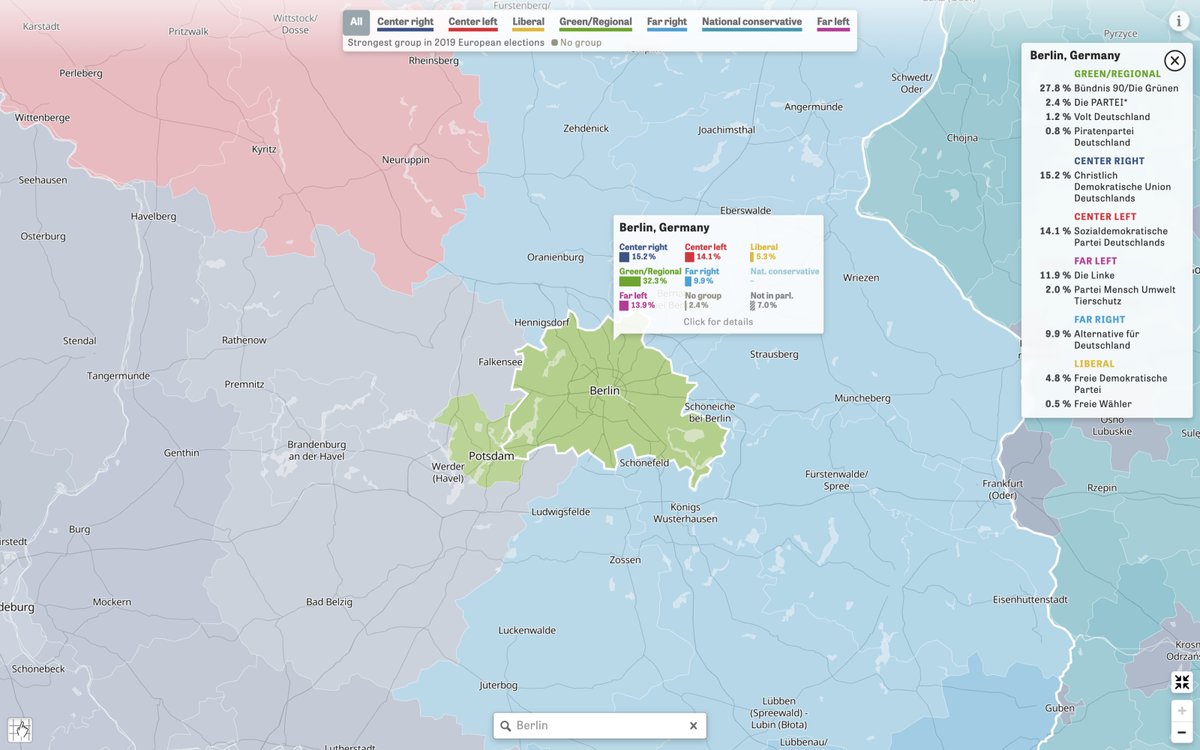
All parties that were taking part in the election were previously categorized by their political classification. That enabled us to colorize and compare all regions with the same criteria and create this comprehensive election map of Europe.

We had worked on multiple election maps before, for example the 2017 federal election in Berlin and Germany, but due to the enormous amount of data, this one was more of a challenge. Although we had already developed a map with the same number of geometries, this time we wanted to use more modern technologies and switch from raster-only to a combination of raster and vector tiles. This had the advantage of showing a mouse-over effect on higher zoom levels and improving the general performance of the map.

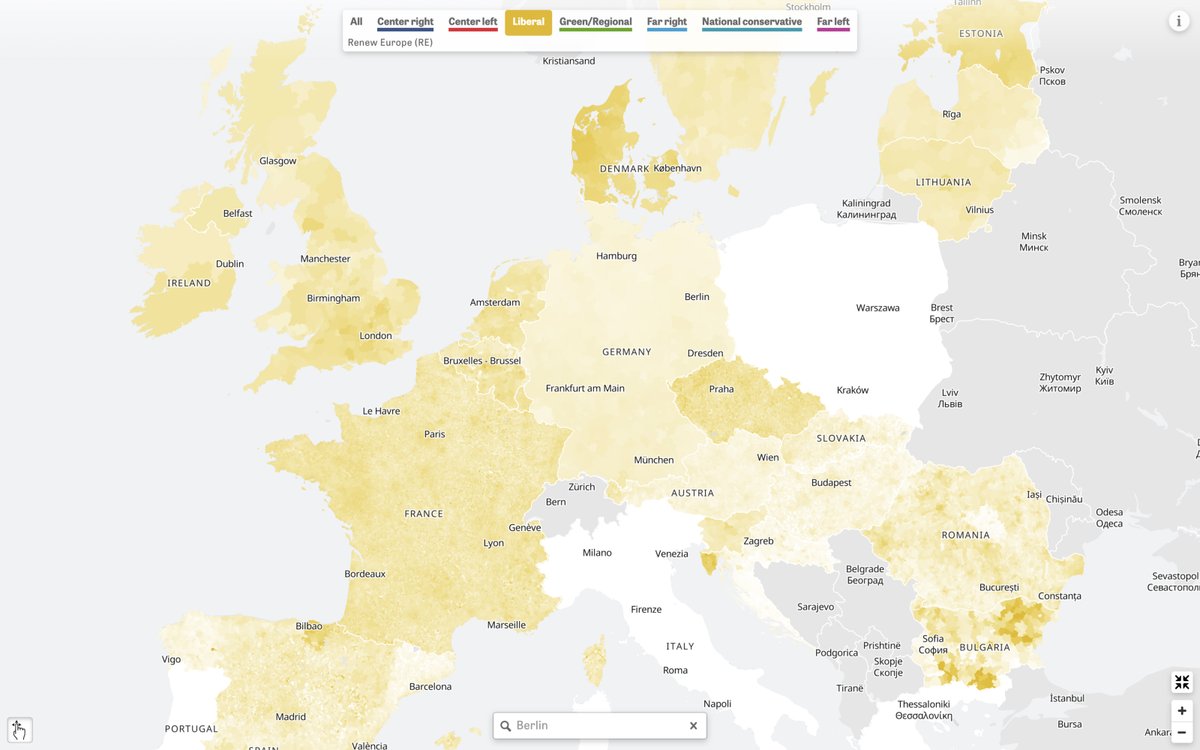
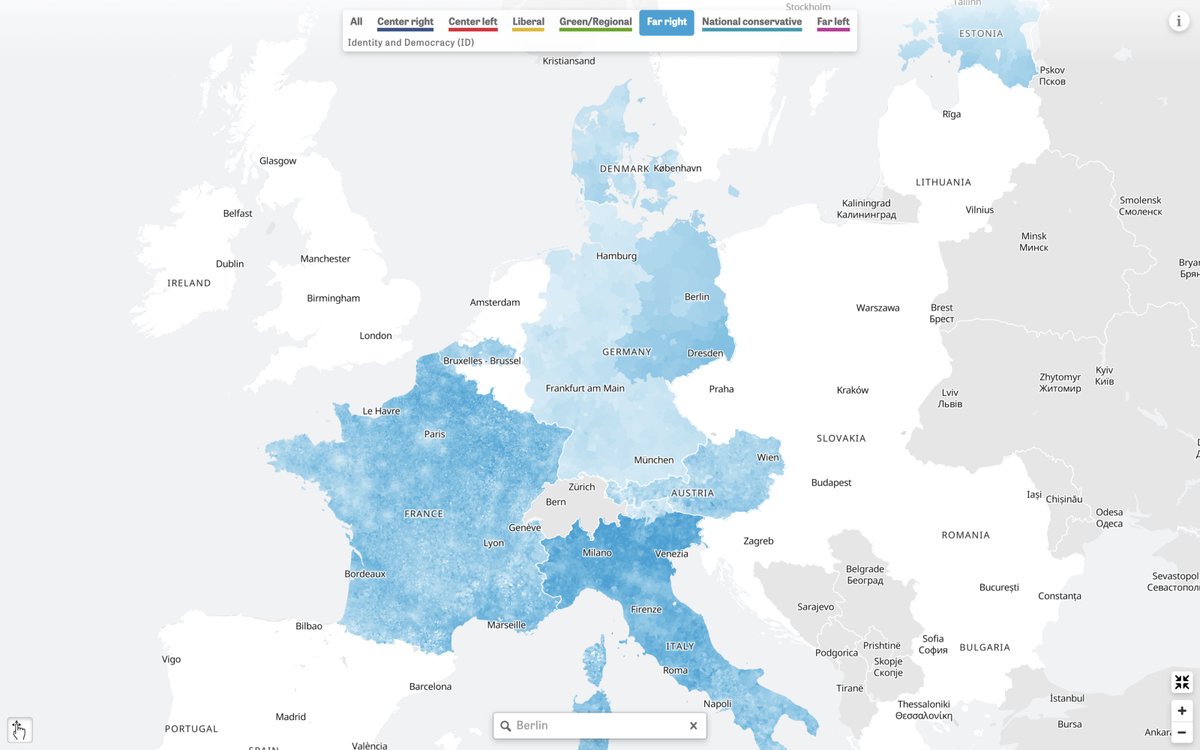
In addition to the election map that is colorized according to the party family which won the region, we rendered a map for each individual party family in order to show their strongholds.
This allowed us to use the legend of the map as a navigation tool and provide more insight into the electoral behaviour throughout Europe.

All the maps that we are showing in this interactive are rendered automatically and use the same dataset. The input dataset is a GeoJSON file which was rendered to vector tiles using Tippecanoe by Mapbox and raster tiles using Node Mapnik. The vector tiles contain the data for each region and their boundaries, whereas the raster tiles are used for colorization.

Both tilesets are composed together with the mapping library mapbox-gl. Through our approach of combining raster and vector tiles, we were able to show a highly detailed colorized map and have an interactive tooltip and mouseover effect as well.
Technology Stack
Mapnik
Tippecanoe
MapboxGL
Are you interested in a collaboration?
Contact us
Featured Projects